


Publicado
The Effects of Visual Information on Willingness to Pay for a Recreational Site Improvement in Chile
Los efectos de la información visual sobre la disposición a pagar por la mejora de un lugar recreativo en Chile
Os efeitos da informação visual sobre a disposição a pagar pela melhora de um local para o lazer no Chile
DOI:
https://doi.org/10.15446/innovar.v24n53.43921Palabras clave:
contingent valuation, visual information, sample biases (en)valoración contingente, información visual, sesgos de la muestra (es)
avaliação contingente, informação visual, tendências da amostra (pt)
Descargas
The Effects of Visual Information on Willingness to Pay for a Recreational Site Improvement in Chile
Los efectos de la información visual sobre la disposición a pagar por la mejora de un lugar recreativo en Chile
Les effets de l'information visuelle sur la disposition à payer pour l'amélioration d'un centre de loisir au Chili
Os efeitos da informação visual sobre a disposição a pagar pela melhora de um local para o lazer no Chile
Arcadio A. CerdaI, Leidy Y. GarciaII, Roberto A. PasténIII, Iván A. DaminoIIII, Mónica T. DiazIIIII
IPh.D. in Economics, Oregon State University. Dean, Faculty of Economics and Business Universidad de Talca. Chile. Correo electrónico: acerda@utalca.cl
IIPh.D. in Economics, Universidad de Chile. Professor, Faculty of Economics and Social Sciences. Universidad Católica del Maule. Chile. Correo electrónico: legarcia@ucm.cl
IIIPh.D. in Economics, University of Alabama. Professor, Faculty of Economics and Business Universidad de Talca. Chile. Correo electrónico: rpasten@utalca.cl
IIIIBBA, Universidad de Talca. Chile. Correo electrónico: idamino@gmail.com
IIIIIBBA, Universidad de Talca. Chile. Correo electrónico: m.diazjor@gmail.com
Citación: Cerda, A., García, L., Pasten, R., Damino, I. & Díaz, M. (2014). The effects of visual information on willingness to pay for a recreational site improvement in Chile. Innovar, 24(53), 141-148.
Clasificación JEL: Q26, H23, D83.
Recibido: Septiembre 2011; aprobado: Octubre 2013.
Abstract:
This article examines the effect of visual information on people's willingness to pay (WTP) for improvements to the infrastructure and water quality of an urban recreation site. We applied the contingent valuation methodology to two groups of people in the City of Talca, Chile. The control group received written information about improvements to be made to a recreational site, whereas the treated group received written and visual information. We found that people who were shown visual illustrations were willing to give more money to support the project than people who were not shown this additional information. We also found that, depending on respondent characteristics, the confidence interval of WTP was lower for people who were provided with visual illustrations than for those who were not. Additionally, users in the treated group were more likely to pay for improvements to be made and lower protest responses.
Key words: Contingent valuation, visual information, sample biases.
Resumen:
Este artículo examina el efecto de la información visual sobre la disposición de las personas a pagar por mejoras en la infraestructura y calidad del agua en un lugar de recreación urbana. Aplicamos la metodología de valoración contingente sobre dos grupos de personas en la ciudad de Talca, Chile. El grupo de control recibió información por escrito sobre una mejora de un sitio recreativo mientras que el grupo tratado recibió información visual y escrita sobre la mejora. Encontramos que las personas a las que se les muestran ilustraciones visuales están dispuestas a dar más dinero para apoyar el proyecto que las personas a las que no se les muestra esta información adicional. También encontramos que, dependiendo de las características de los encuestados, el intervalo de confianza de la disposición a pagar es menor para las personas que reciben las ilustraciones visuales que para las que no. Adicionalmente, los usuarios en el grupo tratado tienen una mayor probabilidad de pagar por una mejora y una menor respuesta de protesta.
Palabras clave: valoración contingente, información visual, sesgos de la muestra.
Résumé:
Cet article examine l'effet del 'information visuelle sur la disposition des personnes à payer pour les améliorations d'infrastructure et de la qualité de l'eau dans un centre de loisir urbain. Nous utilisons la méthodologie d'évaluation contingente sur des groupes de personnes de la ville de Talca, au Chili. Le groupe témoin a reçu l'information par écrit sur une amélioration d'un centre de loisir alors que le groupe traité l'a reçue avec une information visuelle et écrite. Nous avons constaté que les personnes ayant reçu des informations visuelles ont été disposées à donner plus d'argent pour soutenir le projet que celles qui n'avaient pas reçu cette information complémentaire. Nous avons également constaté que, selon les caractéristiques des personnes enquêtées, le niveau de confiance de la disposition à payer est moindre chez les personnes qui reçoivent les illustrations que chez celles qui ne les reçoivent pas. En outre, les usagers du groupe traité ont une plus grande probabilité de payer pour une amélioration et moins de réponses de protestation.
Mots-clés: Evaluation contingente; information visuelle; biais d'échantillonnage.
Resumo:
Este artigo examina o efeito da informação visual sobre a disposição das pessoas a pagar por melhoras na infraestrutura e qualidade da água em um local urbano para o lazer. Aplicamos a metodologia de avaliação contingente sobre dois grupos de pessoas na cidade de Talca, Chile. O grupo de controle recebeu informação por escrito sobre uma melhora de um local para o lazer enquanto o grupo tratado recebeu informação visual e escrita sobre a melhora. Encontramos que as pessoas às quais lhes são mostradas ilustrações visuais estão dispostas a dar mais dinheiro para apoiar o projeto do que as pessoas às quais não lhes é mostrada esta informação adicional. Também encontramos que, dependendo das características dos pesquisados, o intervalo de confiança da disposição a pagar é menor para as pessoas que recebem as ilustrações visuais do que para as que não as recebem. Adicionalmente, os usuários no grupo tratado têm maior probabilidade de pagar por uma melhora e menor resposta de protesto.
Palavras-chave: avaliação contingente, informação visual, tendências da amostra.
Introduction
The contingent valuation method (CVM) is a stated preference approach commonly used for valuing the provision or characteristic changes of a non Marketable good (Freeman, 2003). Despite its ability to supply information for the decision making process involved in providing a recreational public good, CVM has generated extensive discussion about whether the measurement of willingness to pay is biased (Arrow, Solow, Portney, Leamer, Radmer, & Schuman, 1993; Meyerhoff & Liebe, 2006). Several studies have shown that the level and type of information provided may have an impact on WTP estimates. Some of the topics discussed in this regard are as follows: quantity and information complexity (Bergstrom, Stoll, & Randall, 1990; Samples, Dixon, & Gowen, 1986); question ordering, interviewees' experience with environmental goods (Boyle, Welsh, & Bishop, 1993; Boyle, 1989; Cameron & Englin, 1997); information quality (Blomquist & Whitehead, 1998; Hoehn & Randall, 2002); related goods information (Loomis, Caban, & Gregory, 1994; Whitehead & Blomquist, 1991); information and uncertainty about environmental costs and benefits (Macmillan, Hanley,& Buckland, 1996; McCarville, 1991); and changes in market structure (Ajzen, Brown, & Rosenthal, 1996; Cummings, Brookshire, & Schulze, 1986).
Ajzen et al. (1996) concluded that the recommendation to provide detailed information to a given hypothetical market does not offer a satisfactory solution to the information-bias problem. However, other authors consider that the difference in WTP associated with various levels of information is an expected result, which does not constitute a methodological bias (Bergstrom et al., 1989, 1990; Blomquist & Whitehead, 1998). In other words, they expect changes in the market structure to influence individual behavior (Boyle, 1989). Some studies emphasize issues related to the way in which the interviewees incorporate new information, how this information is combined with previous knowledge of the good and how this information is used in the decision making process (Hoehn et al, 2002; Schkade & Payne, 1994; Tkac, 1998).
The respondent's familiarity with a potential site improvement may impact WTP estimates (Cameron & Englin, 1997). Being a resource user constitutes an unambiguous and simple indicator of familiarity (Kniivila, 2006). The validity, reliability and accuracy of WTP estimates have been Discussed in relation to non-users' valuation (Cummings et Al., 1986; diamond & Hausman, 1993). However, while the condition of being a user guarantees some knowledge of the place, it does not necessarily reflect enough knowledge On the user's part to evaluate potential site improvements. Therefore, the information provided to respondents-both users and non-users-should contain sufficient detail to adequately explain a given site improvement.
The information must include the amount, quality and probability of the improvement being implemented. This is presented or displayed in verbal or written form, possibly supported with graphs, photographs or other elements that provide the interviewee with a better image of the amenity being evaluated (Boyle, 2003). Some of these studies include maps or graphs showing the physical areas to be valued (Ahearn et al., 2003; Boyle 1989). An important number of studies provide only written or verbal information, which may result in a significant bias due to contingent market scenarios (Vásquez et al., 2007).
Several studies carried out in Chile have applied the contingent valuation method; however, we are not aware of any of them having using visual information. For the site where this study was applied (Río Claro recreation site), only two water quality related studies (Dumont & Rojas, 1999; Puentes, 1999) were undertaken. Both studies used explanatory cards but no "real" visual information or photos of the improvement project.
The purpose of this study was to test the role of familiarity through visual information and experience (users of the river) on recreational values. Specifically, the objective of this study was to estimate the impact on the mean and variance estimates of WTP for an improvement to the infrastructure and water quality of the recreation site resulting from changes in information provided to respondents. In this case, photos of the site before and after the improvement project were used. The hypothesis was that the more information is provided (verbal and photos), the greater and more stable is the level of WTP. Similarly, respondents who use the recreation site may increase the probability of WTP estimates, given their knowledge of the site. Additionally, a lower level of protest responses is expected to occur when people have more information.
We attempted to clarify the previous issues by administering two surveys to elicit the value of recreational improvements to people using a recreational site in the city of Talca, located south of Santiago, Chile.
Some of the respondents were shown visual informational in the form of computer-generated graphic image. This allowed us to test the effect of visual information on responses and to determine whether the elicited value is different for people who were not shown this additional information.
We tested the effects of visual illustrations on responses in two ways. First, we examined whether mean WTP, dependent on a vector of respondent characteristics (age, in-come, Marital Status, etc.), varied between the two groups. One might, for example, expect that people given visual information would be willing to pay more to support the project than people who are not provided with this additional visual information. Second, we tested whether visual information affects WTP confidence intervals. One might expect that an image would reduce the variance in responses if the latter reflects random noise. Additionally, we tested to determine whether users presented a greater probability of WTP and less protest responses for the site improvement.

This article is organized as follows. In section 2, we describe the project, methods and data. The main results and analysis are presented in section 3 including tests of the effects of visual information. Our conclusions are presented in the final section.
Methods
The case used in the study is a hypothetical improvement of the environmental infrastructure and water quality at the Río Claro tourist site in the city of Talca, Chile. We designed two experiments, which were applied to two simple, stratified, random samples. The respondents of one group (the control group) were provided written but not visual information about the improvement. The respondents of the second group (the treated group), in addition to written information, were provided with visual information consisting of six digital photographs of the current infrastructure and six digital images of the future improvements created using Photoshop. A CVM, in double-bounded dichotomous choice format, was used for the estimation. A linear functional form of the indirect utility function was assumed with a logistic distribution. Additionally, estimations were made using an expanded CVM (Cooper & Hellerstein, 1994).
Site description
The case to which the questionnaires referred was an improvement project for quality of environmental infrastructure and water quality at the Río Claro recreational site in the city of Talca, Chile, about 250 km south of Santiago. Visitors to the recreational site are mainly from its Surrounding area. The site's attractions include restaurants And pubs and recreational activities include boat rides and horseback riding.
Sample
The sampling calculation was obtained assuming maximum variance, a sampling error of 5% and a confidence level of 95%. This resulted in two samples each consisting of 383 individuals.
A simple random sample, stratified by socioeconomic level, was applied in this study to obtain two representative samples from the population of talca1. The city's total population is of around 200.000 people. The distribution of socioeconomic levels-from highest to lowest-in the city is presented in table 1.

Pre-survey and bid Vector
In order to obtain information to estimate the bid vectors to be used in the final survey for both samples, an openended preliminary survey questionnaire was generated and applied to 200 respondents. One hundred of the respondents were provided written information about the improvement project. The other group, in addition to written information, were provided with six digital photographs of the current state fo the site and its state after the implementation of the improvement project. The survey was applied as in-person interviews following arrow et al. (1993). The pre-survey questionnaires were applied in April 2009.
The optimal bid vector (bt) was obtained using the recommendation of Cooper (1993), with information from the preliminary questionnaires. The Bid distribution with equal area Bid selection (DWEABS) routine (Cooper & Hellerstein, 1994) was applied to the data. DWEABS is an iterative technique for finding the sample design, which minimizes the mean square error (MSE) for a dichotomous, choice-contingent valuation model survey. In addition, the DWEABS procedure enabled us to obtain the optimal sample associated with each optimal bid value, which minimizes the mean square error of the welfare measures. The final survey used these optimal bid values, in a dichotomous-choice question, to obtain the WTP.
Design of Final surveys and study
Final survey questionnaires were applied the last two weeks of may 2009 through inperson interviews at the respon Dents' homes. The questionnaire had three main parts. The first part featured questions about site uses, the second part provided a description of the present situation, and the third part described the contingent market and asked several questions about the respondent's socioeconomic profile. This last part also included questions about protest responses to identify those respondents who rejected the contingent market for economic reasons. Some authors have suggested those respondents should be included in the final data in the no-no response category.
As with the preliminary questionnaire, in the main survey two experimental designs were presented to respondents: a design with images and a design without images, with a double-bounded dichotomous choice format. The latter survey explains the current situation in 139 words and the contingent situation in 315 words, with and without photographs. It included information about the payment vehicle (water bill), income restrictions, substitute goods reminding, project cost, and the organization in charge of the project, protest responses for economic reasons, among other aspects.
Estimation method
The model applied was based on a difference in the utility function model (Hanemann, 1984). In the estimate of the contingent valuation model, in its double-bounded dichotomous choice format (Hannemann, 1984; Hanneman et al, 1991), and assuming a linear functional form for the indirect utility function with a logistic distribution, the CVM program of Cooper and Hellerstein (1994) was used. This program uses maximum likelihood estimation with the analytic first and second derivatives from Hanemann, Loomis, and Kanninen (1991). The confidence intervals related to the willingness to pay measurement are constructed using the Krinsky and Robb approach (Park et al., 1991). Additionally, estimates are also made using an expanded CV model (Cooper & Hellerstein, 1994).
Given that a linear utility function is assumed, the difference in the utility function can be expressed as, Dv = a1 - b1bi, where bi correspond to the bid vector, which represents the different "prices" asked to individuals to obtain a change in infrastructure and water quality (Cerda et al., 2012). In this study, we calculated the restricted mean of WTP (positive integral) with the expression ln (1 + exp a)/abs (b1), be-cause it is consistent with theoretical constraints (Lee and Mjelde, 2007). Also, the confidence intervals for the welfare mean measurement were obtained using the Krinsky and Robb approach (Park et al., 1991) and Cameron's approach (Cameron, 1991). All calculations were made following Cooper and Hellerstein (1994).
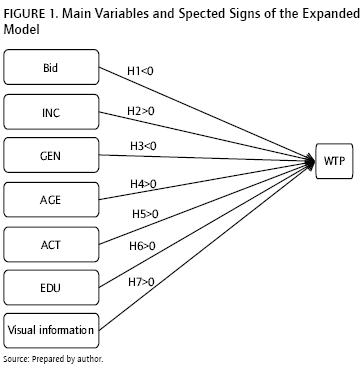
Additionally, an expanded model was estimated and expressed as Δv =α-βiZi where Zi is any variable explaining the WTP (Cooper & Hellerstein, 1994); in this case, it is expressed as: Δv = a1 - β1bi + β2 INC + β3 AGE + β4 GEN + β5 ACT + β6 EDU + η where INC: average family income; AGE: age; EDU: level of education; GEN: gender, female=0, male=1; ACT: participates in activities on the site or know the site, yes=1, no=0. The same welfare measure is calculated assuming α= α1 + β2 INC + β3 AGE + β4 GEN + β5 ACT + β6 EDU, and β = β1 which allows for consistency with the linear model.
Results and analysis
The principal results from the implementation of the methodology to the control and to the treated group are presented in table 2. Columns (1) and (2) present the estimates using the control and treated groups respectively for the traditional Hanemann model. Columns (3) and (4) show the estimates to both groups for the expanded model. Finally, column (5) merges the control and treated groups and includes a dummy to show differential responses between both groups. Also, a variable to differentiate users from non-users is included.

The signs of the coefficients are as expected and significant. For instance; the greater the bid (price associated to improve the site), the less the likelihood that people will pay for the proposed change. The expanded model shows some difference between the respondents who were shown the photographs and those who weren't in terms of the variables that explain the WTP. For instance, for those who were shown the photographs, the significant variables are income and the dichotomous variable, which shows that the person had participated in activities on the river. In contrast, for those who were not shown the photo, those variables were not statistically significant, unlike level of education, which was statistically significant for this group. Additionally, the dummy variable identifying site users was statistically significant and it have a positive sign, as the literature has shown; users are more likely to pay for environmental improvement.
A general description of the variables considered is presented in Table 2, where we can see that the majority of respondents are women (56.9%) and 57.7% of them are users of the recreational site. Figure 1 shows the main variables and the expected signs with respect to WTP. The decision making process is complex for respondents and, it is expected that WTP will increase as individuals receive more information (Bergström & Stoll, 1990). Our study supports this statement showing that WTP for the control group (without inclusion of visual information) was lower than the treated group (with the inclusion of visual information). Moreover, in Table 4, we can observe a reduction in protest responses from 119 to 64 respondents, when visual information is included.


The difference in WTP between both groups is displayed in Table 5. The point estimates for both models show that WTP is greater for the treated group (with visual information). The restricted WTP point estimates are outside of the confidence intervals in both cases and the confidence intervals are not coincident at all. Moreover, this study shows that the more information the respondents received, the greater their WTP.
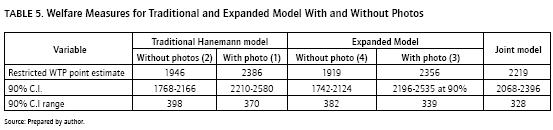
According to our findings, people show a greater sensitivity when they receive more information, in this case, by observing photos of the possible result of the improvement project. The results show that the probability of WTP increases from 1946 to 2386 Chilean pesos in the traditional Hanemann model. It also increases in the expanded model from 1919 to 2356 Chilean pesos. Sample et al. (1986) found that welfare measures are highly sensitive to the information provided to respondents, which is consistent with our results. Additionally, Boyle and Bishop (1988) show that welfare measure efficiencies increased as the respondents were given more information, which is what occurred in our study, with a reduction in the confidence intervals range from 398 to 370 for the Hanemann model (1984). Also, the dummy variable identifying respondents which observed photos of the improvement, or people who appeal to an additional sense by visual information, are more likely to pay for environmental improvements to be made.
Conclusion
The hypothesis bias is a well-known problem in contingent valuation studies and several authors have explored the issue and have proposed methods to reduce this bias. The present study is a contribution in this area because it tests the idea that visual information can help to mitigate the bias.
Examining the willingness to pay (WTP) of people in Talca, Chile for an improvement in infrastructure and water quality of an urban recreation site, we applied the contingent valuation methodology to two groups of people in the city of Talca, Chile. We found that people for whom written information is supplemented with visual information about the project improvement are willing to give more money and have lower variance in their answers than people in a control group supplied only with written information. We also found that users of the recreational site are more likely to pay for an improvement and present fewer protest responses.
How to increase the accuracy of contingent valuation methods is an important issue of study. We present evidence that visual information helps in this sense; however, more research in this area is necessary to corroborate this fact to a more general scale not only restricted to a local community as is the case in this study. However, based on this study, the contingent valuation studies that do not include visual information, should be considered with care given that those studies may have a bias estimation of the WTP.
Also as a referee correctly pointed out that it is necessary to explore more variables that can shed light on the willingness to pay for improvements to be made in recreational sites. For example, an interesting issue to explore is the interaction between visual information and previous knowledge of the site. It will be possible then to see whether the marginal impact of visual information is higher for nonusers than for users. Additionally, an interesting aspect to consider in future research is the impact of interviewer influences o characteristics on willingness to pay estimates.
Some of the limitations of this study are that respondents' answers may be affected by the weather conditions as well the alternative sites available to them, and these aspects were not considered in this case.
Notes
1See Ruesink (1980) for an introduction to sampling theory.
References
Ahearn, M., Hellerstein, D., & Boyle, K. J. (2003). Designing contingent valuation study to estimate benefits of the Conservation Reserve Program on Grassland bird populations. In J. Kahn, D. Bjornstand, & A. Alberini (Eds.), Contingent Valuation Handbook. Cheltenham, U. K.: Edward Elger.
Ajzen, I., Brown, T., & Rosenthal, L. (1996). Information bias in contingent valuation: Effects of personal relevance, quality of information, and motivational orientation. Journal of Environmental Economics and Management, 30(1), 43-57.
Arrow, K., Solow, R., Portney, P., Leamer, E., Radmer, R., & Schuman, H. (1993). Report of the NOAA Panel on Contingent Valuation. Federal Register, 58, 4601-14.
Bergström, J., Stoll, J., & Randall, A. (1989). Information effects in contingent markets. American Journal of Agricultural Economics, 71, 685-689.
Bergstrom, J., Stoll, R., & Randall, A. (1990). The impact of information on environmental evaluation decision. Australian Journal of Agricultural and Resource Economics, 72, 614-621.
Bergstrom, J.C., & Stoll, J.R. (1990). An analysis of information overload with implications for survey design research. Leisure Sciences 12, 265-280.
Blomquist, G., & Whitehead, J. (1998). Resource quality information and validity of willingness to pay in contingent valuation. Resource and Energy Economics, 20, 179-196.
Boyle, K. (2003). Contingent valuation in practice. In P. A. Champ, K. J. Boyle, & T. C. Brown (Eds.), A primer on nonmarket valuation: The economics of non-market goods and resources. London: Kluwer Academic Publishing.
Boyle, K. (1989). Commodity specification and the framing of contingent valuations questions. Land Economics, 65, 57-63.
Boyle, K., Welsh, M., & Bishop, R. (1993). The role of question order and experience in contingent valuation studies. Journal of Environmental Economics and Management, 25, 80-99.
Boyle, K., & Bishop, R. (1988). Welfare Measurements Using Contingent Valuation: A Comparison of Techniques. American Journal of Agricultural Economics, 70, 20-28.
Cameron, T. (1991). Interval estimates of non-Market Resource values from Referendum Contingent valuation surveys. Land Economics, 67 (4), 413-421.
Cameron, T., & Englin, J. (1997). Respondent experience and contingent valuation of environmental goods. Journal of Environmental Economics and Management, 33, 296-331.
Cerda, A., García, L., Ortega, S., & Ubilla, A. (2012). Consumers preferences and willingness to pay for organic apples: Contingent valuation and conjoint analysis. Revista Ciencia e Investigación Agraria, 39(1), 47-51.
Cummings, R., Brookshire, D., & Schulze, W. (1986). Valuing environmental goods: An assessment of the contingent valuation method. Totowa, NJ: Rowman and Allenheld.
Cooper, J. (1993). Optimal bid selection for dichotomous choices contingent valuation surveys. Journal of Environmental Economics and Management, 24, 25-40.
Cooper, J., & Hellerstein, D. (1994). CVM a Collection of dichotomous choice and Double-Bounded CVM related routines. USDA/NRS/ Resources and technology division, 1301 New York. Ave. NW, RM. 508, Washington, D. C., 20005-4788_1994.
Diamond, P., & Hausman, J. (1993). On Contingent valuation measurement of non- use values, In Hausman, J., Contingent Valuation: A Critical Assessment. Amsterdam: North Holland Press, (pp 3-38).
Dumont, A., & Rojas, C. (1999). Valoración económica de los beneficios recreacionales provenientes de una mejora en la calidad de las aguas del Río Claro. Tesis de grado de licenciado en Ciencias de la administración de empresas mención administración. Universidad de Talca, Facultad de Ciencias Empresariales. Talca, Chile.
Freeman, M. (2003). The measurement of environmental and resource ralues: Theory and methods, resources for the future. Washington: Resources for the Future.
Hanemann, M., Loomis, J., & Kanninen, B. (1991). Statistical efficiency of doubleboundeddichotomous choice contingent valuation. American Journal of Agricultural Economics, 73, 1255-1263.
Hanemann, W. (1984). Welfare evaluations in contingent valuation experiments with discrete responses. American Journal of Agricultural Economics, 66, 332-441.
Hanley, N., & Munro, A. (1994). The effects of information in contingent market forenvironmental goods (Working Paper e94/5). Department of economics, University of Sterling.
Hoehn, J., & Randall, A. (2002). The effect of resource quality information on resourceinjury perceptions and contingent values. Resource and Energy Economics, 24, 13-31.
Kniivilla, M. (2006). Users and non-users of conservation areas: are there differences in WTP, motives and the validity of responses in CVM surveys?. Ecological Economics, 59(4), 530-539.
Kotchen, M., & Reiling, S. (1999). Do reminders of substitutes and budget constraints Contingent valuation estimates? Another Comment. Land Economics, 75, 478-482.
Lee, C. & Mjelde J. (2007). Valuation of ecotourism Resources Using a Contingent valuation method: the Case of the Korean DMZ. Ecological Economics, 63, 511-520.
Loomis, J., Caban, A., & Gregory, R. (1994). Do reminders of substitutes and budget constraints influence contingent valuation estimates? Land Economics, 70, 499-506.
Macmillan, D., Hanley, N., & Buckland, S. (1996). A contingent valuation study of uncertain environmental gains. Scottish Journal of Political Economy, 43, 519-533.
McCarville, R. (1991). An empirical investigation of the influence of cost information on willingness to pay for public aerobics classes. Leisure Sciences, 13, 85-96.
Meyerhoff, J., & Liebe, U. (2006). Protest beliefs in contingent valuation: explaining their motivation. Ecological Economics, 57, 583-594.
Park, T., Loomis, J.B., & Creel, M. (1991). Confidence intervals for evaluating benefit estimates from dichotomous choice contingent valuation studies. Land Economics, 67, 64-73.
Puentes, L. (1999). Comparación de las medidas de bienestar, obtenidas al utilizar muestras estratificadas proporcional y aproporcionalmente aplicando el método de valoración contingente para una mejora en la calidad de las aguas del cauce del Río Claro - Talca. Tesis de grado de licenciado en Ciencias empresariales. Universidad de Talca, Facultad de Ciencias empresariales. Talca, Chile.
Ruesink, W. G. (1980). Introduction to sampling theory. In M. Kogan & D.C. Herzog (eds.), Sampling methods in soybean entomology. Springer-Verlag. New York. Pp. 61-78.
Samples, K.C., Dixon, J.A., & Gowen, M.M. (1986). Information disclosure and endangeredspecies valuation. Land Economics, 62, 306.312.
Schkade, D., & Payne, J. (1994). How people respond to contingent valuation questions: a verbal protocol analysis of willingness to pay for an environmental regulation. Journal of Environmental Economics and Management, 26, 88-109.
Tkac, J., (1998). The effects of information on willingness to pay values of endagered species. American Journal of Agricultural Economics, 80, 1214-1220.
Vásquez, F., Cerda, A., & Orrego, S. (2007). Valoración económica del ambiente (pp. 356). Buenos Aires: Thomson Learning.
Whitehead, J., & Blomquist, G. (1991). Measuring contingent values for wetlands: effects of information about related. Water Resources Research, 27, 2523-2531.
Referencias
Ahearn, M., Hellerstein, D., & Boyle, K. J. (2003). Designing contingent valuation study to estimate benefits of the Conservation Reserve Program on Grassland bird populations. In J. Kahn, D. Bjornstand, & A. Alberini (Eds.), Contingent Valuation Handbook. Cheltenham, U. K.: Edward Elger.
Ajzen, I., Brown, T., & Rosenthal, L. (1996). Information bias in contingent valuation: Effects of personal relevance, quality of information, and motivational orientation. Journal of Environmental Economics and Management, 30(1), 43-57.
Arrow, K., Solow, R., Portney, P., Leamer, E., Radmer, R., & Schuman, H. (1993). Report of the NOAA Panel on Contingent Valuation. Federal Register, 58, 4601-14.
Bergström, J., Stoll, J., & Randall, A. (1989). Information effects in contingent markets. American Journal of Agricultural Economics, 71, 685-689.
Bergstrom, J., Stoll, R., & Randall, A. (1990). The impact of information on environmental evaluation decision. Australian Journal of Agricultural and Resource Economics, 72, 614-621.
Bergstrom, J.C., & Stoll, J.R. (1990). An analysis of information overload with implications for survey design research. Leisure Sciences 12, 265-280.
Blomquist, G., & Whitehead, J. (1998). Resource quality information and validity of willingness to pay in contingent valuation. Resource and Energy Economics, 20, 179-196.
Boyle, K. (2003). Contingent valuation in practice. In P. A. Champ, K. J. Boyle, & T. C. Brown (Eds.), A primer on nonmarket valuation: The economics of non-market goods and resources. London: Kluwer Academic Publishing.
Boyle, K. (1989). Commodity specification and the framing of contingent valuations questions. Land Economics, 65, 57-63.
Boyle, K., Welsh, M., & Bishop, R. (1993). The role of question order and experience in contingent valuation studies. Journal of Environmental Economics and Management, 25, 80-99.
Boyle, K., & Bishop, R. (1988). Welfare Measurements Using Contingent Valuation: A Comparison of Techniques. American Journal of Agricultural Economics, 70, 20-28.
Cameron, T. (1991). Interval estimates of non-Market Resource values from Referendum Contingent valuation surveys. Land Economics, 67 (4), 413-421.
Cameron, T., & Englin, J. (1997). Respondent experience and contingent valuation of environmental goods. Journal of Environmental Economics and Management, 33, 296-331.
Cerda, A., García, L., Ortega, S., & Ubilla, A. (2012). Consumers preferences and willingness to pay for organic apples: Contingent valuation and conjoint analysis. Revista Ciencia e Investigación Agraria, 39(1), 47-51.
Cummings, R., Brookshire, D., & Schulze, W. (1986). Valuing environmental goods: An assessment of the contingent valuation method. Totowa, NJ: Rowman and Allenheld.
Cooper, J. (1993). Optimal bid selection for dichotomous choices contingent valuation surveys. Journal of Environmental Economics and Management, 24, 25-40.
Cooper, J., & Hellerstein, D. (1994). CVM a Collection of dichotomous choice and Double-Bounded CVM related routines. USDA/NRS/ Resources and technology division, 1301 New York. Ave. NW, RM. 508, Washington, D. C., 20005-4788_1994.
Diamond, P., & Hausman, J. (1993). On Contingent valuation measurement of non- use values, In Hausman, J., Contingent Valuation: A Critical Assessment. Amsterdam: North Holland Press, (pp 3-38).
Dumont, A., & Rojas, C. (1999). Valoración económica de los beneficios recreacionales provenientes de una mejora en la calidad de las aguas del Río Claro. Tesis de grado de licenciado en Ciencias de la administración de empresas mención administración. Universidad de Talca, Facultad de Ciencias Empresariales. Talca, Chile.
Freeman, M. (2003). The measurement of environmental and resource ralues: Theory and methods, resources for the future. Washington: Resources for the Future.
Hanemann, M., Loomis, J., & Kanninen, B. (1991). Statistical efficiency of doubleboundeddichotomous choice contingent valuation. American Journal of Agricultural Economics, 73, 1255-1263.
Hanemann, W. (1984). Welfare evaluations in contingent valuation experiments with discrete responses. American Journal of Agricultural Economics, 66, 332-441.
Hanley, N., & Munro, A. (1994). The effects of information in contingent market forenvironmental goods (Working Paper e94/5). Department of economics, University of Sterling.
Hoehn, J., & Randall, A. (2002). The effect of resource quality information on resourceinjury perceptions and contingent values. Resource and Energy Economics, 24, 13-31.
Kniivilla, M. (2006). Users and non-users of conservation areas: are there differences in WTP, motives and the validity of responses in CVM surveys?. Ecological Economics, 59(4), 530-539.
Kotchen, M., & Reiling, S. (1999). Do reminders of substitutes and budget constraints Contingent valuation estimates? Another Comment. Land Economics, 75, 478-482.
Lee, C. & Mjelde J. (2007). Valuation of ecotourism Resources Using a Contingent valuation method: the Case of the Korean DMZ. Ecological Economics, 63, 511-520.
Loomis, J., Caban, A., & Gregory, R. (1994). Do reminders of substitutes and budget constraints influence contingent valuation estimates? Land Economics, 70, 499-506.
Macmillan, D., Hanley, N., & Buckland, S. (1996). A contingent valuation study of uncertain environmental gains. Scottish Journal of Political Economy, 43, 519-533.
McCarville, R. (1991). An empirical investigation of the influence of cost information on willingness to pay for public aerobics classes. Leisure Sciences, 13, 85-96.
Meyerhoff, J., & Liebe, U. (2006). Protest beliefs in contingent valuation: explaining their motivation. Ecological Economics, 57, 583-594.
Park, T., Loomis, J.B., & Creel, M. (1991). Confidence intervals for evaluating benefit estimates from dichotomous choice contingent valuation studies. Land Economics, 67, 64-73.
Puentes, L. (1999). Comparación de las medidas de bienestar, obtenidas al utilizar muestras estratificadas proporcional y aproporcionalmente aplicando el método de valoración contingente para una mejora en la calidad de las aguas del cauce del Río Claro - Talca. Tesis de grado de licenciado en Ciencias empresariales. Universidad de Talca, Facultad de Ciencias empresariales. Talca, Chile.
Ruesink, W. G. (1980). Introduction to sampling theory. In M. Kogan & D.C. Herzog (eds.), Sampling methods in soybean entomology. Springer-Verlag. New York. Pp. 61-78.
Samples, K.C., Dixon, J.A., & Gowen, M.M. (1986). Information disclosure and endangeredspecies valuation. Land Economics, 62, 306.312.
Schkade, D., & Payne, J. (1994). How people respond to contingent valuation questions: a verbal protocol analysis of willingness to pay for an environmental regulation. Journal of Environmental Economics and Management, 26, 88-109.
Tkac, J., (1998). The effects of information on willingness to pay values of endagered species. American Journal of Agricultural Economics, 80, 1214-1220.
Vásquez, F., Cerda, A., & Orrego, S. (2007). Valoración económica del ambiente (pp. 356). Buenos Aires: Thomson Learning.
Whitehead, J., & Blomquist, G. (1991). Measuring contingent values for wetlands: effects of information about related. Water Resources Research, 27, 2523-2531.
Cómo citar
APA
ACM
ACS
ABNT
Chicago
Harvard
IEEE
MLA
Turabian
Vancouver
Descargar cita
CrossRef Cited-by
1. Jacob Ladenburg. (2020). Testing the Correlation between Prior Knowledge of - and Visualisation Guided WTPs for Reducing the Visual Impacts Visual from Offshore Wind Farms. Journal of Energy and Power Technology, 02(03), p.1. https://doi.org/10.21926/jept.2003015.
2. Moritz A. Drupp, Zachary Turk, Ben Groom, Jonas Heckenhahn. (2024). Limited Substitutability, Relative Price Changes and the Uplifting of Public Natural Capital Values. SSRN Electronic Journal, https://doi.org/10.2139/ssrn.4868737.
3. Pablo Hevia-Koch. (2016). Estimating Preferences for Wind Turbine Locations - A Critical Review of Visualisation Approaches. SSRN Electronic Journal, https://doi.org/10.2139/ssrn.2848529.
4. Leidy Y. García, Arcadio A. Cerda, Rocio del P. Lagos, Patricio I. Muñoz, Monserrat Muñoz. (2021). Society’s Willingness to Pay for Certified Dry Firewood Energy in Chile. Frontiers in Energy Research, 9 https://doi.org/10.3389/fenrg.2021.676654.
5. Chisomo Haswell, Robertson R B. Khataza. (2025). Seeing is believing: the effect of product-quality validation on consumer willingness to pay (WTP) for high-quality agroforestry seedlings in Malawi. Agroforestry Systems, 99(8) https://doi.org/10.1007/s10457-025-01339-w.
6. Pablo Hevia-Koch, Jacob Ladenburg. (2019). Where should wind energy be located? A review of preferences and visualisation approaches for wind turbine locations. Energy Research & Social Science, 53, p.23. https://doi.org/10.1016/j.erss.2019.02.010.
7. Attila Pohlmann, Franklin Velasco, Eva M. Guerra-Leal, Cesar J. Sepulveda. (2023). Elevating the boutique appeal: generating a sense of place in luxury hospitality through virtual tours. Consumer Behavior in Tourism and Hospitality, 18(1), p.66. https://doi.org/10.1108/CBTH-05-2022-0121.
Dimensions
PlumX
Visitas a la página del resumen del artículo
Descargas
Licencia
Derechos de autor 2014 Innovar

Esta obra está bajo una licencia internacional Creative Commons Reconocimiento-NoComercial-CompartirIgual 3.0.
Todos los artículos publicados por Innovar se encuentran disponibles globalmente con acceso abierto y licenciados bajo los términos de Creative Commons Atribución-No_Comercial-Sin_Derivadas 4.0 Internacional (CC BY-NC-ND 4.0).
Una vez seleccionados los artículos para un número, y antes de iniciar la etapa de cuidado y producción editorial, los autores deben firmar una cesión de derechos patrimoniales de su obra. Innovar se ciñe a las normas colombianas en materia de derechos de autor.
El material de esta revista puede ser reproducido o citado con carácter académico, citando la fuente.
Esta obra está bajo una Licencia Creative Commons:


