


Publicado
Estimation of catchment averaged sensible heat fluxes using a large aperture scintillometer
Palabras clave:
Evapotranspiration, heat flux, Scintillometer, Calibration, validation (es)Estimation of catchment averaged sensible heat fluxes using a large aperture scintillometer
Estimación de los flujos promedio de calor usando técnicas de escintilometría
Bruno Samain1 Bram V. A. Ferket1 Willem Defloor2 Valentijn R. N. Pauwels1
1. Laboratory of Hydrology and Water Management ,Ghent University, Ghent, Belgium.
2. Department of Operational Water Management, Flemish Environmental Agency, Brussels, Belgium.
Recibido para evaluación: 30 de Septiembre de 2011 Aceptación: 01 de Diciembre de 2011 Recibido version final: 12 de Diciembre de 2011
ABSTRACT
Evapotranspiration rates at the catchment scale are very diffcult to quantify. One possible manner to continuously observe this variable could be the estimation of sensible heat fuxes (H) across large distances (in the order of kilometers) using a large aperture scintillometer (LAS), and inverting these observations into evapotranspiration rates, under the assumption that the LAS observations are representative for the entire catchment. The objective of this paper is to assess whether measured sensible heat fuxes from a LAS over a long distance (9.5 km) can be assumed to be valid for a 102.3 km2 heterogeneous catchment. Therefore, a fully process-based water and energy balance model with a spatial resolution of 50 m has been thoroughly calibrated and validated for the Bellebeek catchment in Belgium. A footprint analysis has been performed. In general, the sensible heat fuxes from the LAS compared well with the modeled sensible heat fuxes within the footprint. Moreover, as the modeled H within the footprint has been found to be almost equal to the modeled catchment averaged H, it can be concluded that the scintillometer measurements over a distance of 9.5 km and an effective height of 68 m are representative for the entire catchment.
Key words: Evapotranspiration, heat fux, Scintillometer, Calibration, validation
RESUMEN
Las tasas de evapotranspiración a escala de cuenca son muy dificiles de cuantifcar. Una posible manera de medir de manera continuada dicha variable es la estimación de los fujos de calor (H) a lo largo de la cuenca (en km) utilizando la tecnica del escintilometro de gran apertura (LAS) y convirtiendo dichos datos observados en tasas de evapotranspiración, asumiendo que las observaciónes LAS son representativas para toda la cuenca. El objetivo de este articulo es valorar si el fujo de calor calculado mediante LAS a lo largo de la distancia (9,5 km) se puede asumir como valida para la superfcie de la cuenca, en este caso heterogenea, de 102.3 km2. En este estudio se calibr6 y valid6 en la cuenca de Bellebeek, en Belgica, un modelo de balance de agua y energia con una resolución de 50 m. Se realiz6 un analisis de los datos y en general los fujos obtenidos mediante LAS se asemejan bastante con los fujos modelados. Además como los valores de H modelados son casi iguales a las H medias simuladas, se puede concluir que las mediciónes mediante escintilometria en una distancia de 9,5 km y una altura efectiva de 68 m son representativas para la cuenca entera.
Palabras claves: evapotraspiración, fujos de calor, escintilometro, calibración, validación
1.INTRODUCTION
Estimates of catchment- averaged evapotranspiration rates are of interest for a number of scientifc disciplines, including climate modeling and numerical weather prediction, and operational food forecasting. These estimates can be obtained using a number of different methods. A frst approach is the weighted averaging of point scale observations, which can be obtained under a number of different land use conditions, using the Bowen ratio energy balance (BREB) and/or the eddy covariance (EC) methods. This approach suffers from a number of drawbacks. More specifcally, evapotranspiration rates do not only depend on the land cover type, but also on the soil moisture conditions. Due to the effect of topography, these soil moisture contents can show a high-spatial variability. As a consequence, in many cases, it can be very diffcult, or even impossible, to measure representative values for a specifc land cover class. Furthermore, EC observations are known to show errors in the energy balance closure, which under certain circumstances can be relatively large. This can thus be expected to lead to additional errors in the areal estimates.
Remote sensing observations can also be used. Although this method directly leads to spatial distributions in the evapotranspiration rates, it suffers from the drawback that the results are prone to a relatively high degree of uncertainty. Furthermore, remote sensing imagery is available at specifed instances in time only, which reduces its applicability in, for example, operational food forecasting.
Another possibility to estimate surface fuxes across large distances, that is quickly emerging in hydrologic applications, is the scintillation method. This method has the potential to provide surface fuxes of sensible heat (H) or water vapor (E) across a distance of several kilometers. For latent heat fux measurements, scintillometers that operate at radio wavelengths are most suited. Until now the expensive technology, the complexity, absorption effects, and required licenses are the main reasons why such scintillometers have not been used as often as the near-infrared laser and LAS, which are used for estimating the sensible heat fux.
Typically, a LAS consists of a transmitter, which emits an optical signal, and a receiver, which measures the strength of the signal at the end of a predefned path. Fluctuations in the received intensity are a measure of fuctuations in the refractive index n expressed as the structure parameter of n, which in turn is related to the sensible heat fux averaged along the path. Techniques can then be explored to convert this large- distance sensible heat fux into latent heat fuxes using estimates of the net radiation and the ground heat fux.
The overall objective of this paper is to demonstrate that scintillometer-based sensible heat fux values, obtained across a long distance (9.5 km), can be assumed to be representative for the entire catchment in which the measurements are taken, based on a validation of the scintillometer measured sensible heat fuxes using modeled sensible heat fuxes from a land surface model. For this reason, a boundary- layer scintillometer has been installed in the catchment of the Bellebeek (102.3 km2) in Belgium. A long time series of sensible heat fuxes have been obtained using this instrument, more specifcally from 21 February 2008 through 28 August 2009.
A footprint analysis has been performed in order to assess whether the sensible heat fux within the source area of the scintillometer is comparable to the sensible heat fux of the entire catchment. Because it is impossible to measure sensible heat fuxes on a regular spatial grid, a land surface model-based approach is used. More specifcally, a spatially distributed physically based land surface model has been calibrated and validated using BREB data and discharge data. If the model can adequately simulate the observations of the BREB stations and the measured discharge, the resulting sensible heat fux values can be assumed to be of suffcient quality to be used in the footprint analysis. If the sensible heat fux from the footprint of the scintillometer is consistently similar to the catchment average, the assumption can be made that the scintillometer data are representative for the entire catchment. This paper provides an answer to the question of under which conditions this assumption can or cannot be made.
2.SITE AND DATA DESCRIPTION
2.1.Site Description
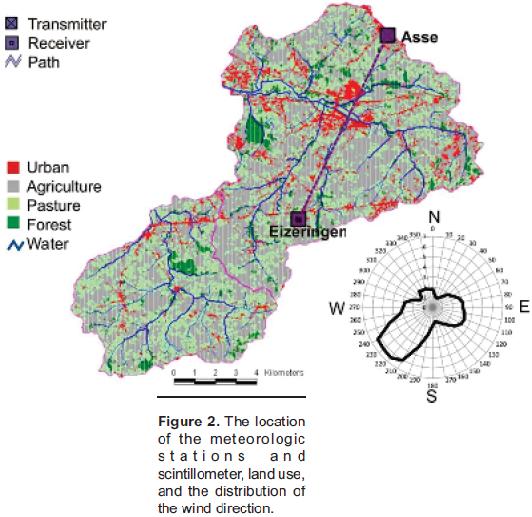
The study was performed in the Dender catchment in Belgium. A LAS was installed in the subcatchment of the Bellebeek (102.3 km2). For the calibration and validation of the hydrologic model, data from the neighboring subcatchment of the Wolfputbeek (48.6 km2) are used as well. Figure 1 shows the location of the catchments together with a digital elevation model (DEM) of the area. The elevation in the subcatchments ranges between 10 and 110 m. Soil texture is predominantly loam (74%), and the land use (shown in Figure 2) is predominantly agriculture (63.6%) and pasture (22.9%). 8.6% of the surface consists of urban land cover and the rest of the area consists of forest (4.8%) and open water (0.1%).
2.2.The Meteorological and Discharge Data
Figure 2 shows the location of the different stations used in this study. Discharge observations were available with an hourly time step at the outlet of the Bellebeek sub- catchment. Measurements of wind speed and wind direction at 10 m height, as well as precipitation rates, air pressure, and air and dew point temperature at a height of 2 m were available at 10 min intervals at the meteorological station of Liedekerke, situated near the outlet of the catchment. Furthermore, net radiation and ground heat fux observations were also available at this site.

2.3.The Bowen Ratio Energy Balance (BREB) Data
From 15 August 2007 through 15 July 2008, a Bowen-ratio station was installed on a pasture feld in Gooik in the subcatchment of the Wolfputbeek. From 3 September 2008 through 28 August 2009, this BREB station was installed in Ternat on a grassland approximately in the middle of the scintillometer path. The BREB station consists of two HMP45C capacitive probes with radiation shield (Vaisala, Woburn, Mássachusetts) for measuring air temperature and relative humidity at two different heights (1 and 2 m), a CMP3 pyranometer (Kipp and Zonen, Delft, Netherlands), and a NR- Lite net radiometer (Kipp and Zonen, Delft, Netherlands) at 2 m height, and two HFP01SC soil heat fux sensors (Huksefux, Delft, Netherlands) installed just below the surface.
BREB data are reliable during daytime and nighttime, but not at the transition in between. Unreliable estimates of the turbulent fuxes are then obtained because of very small gradients in the air humidity. Therefore, Bowen ratios smaller than 0.7 and larger than 10 are omitted, as well as Bowen ratios where the water vapor gradient is zero or negative.
2.4.Geographical Information
A digital elevation model (DEM) with an accuracy of 0.07 m and soil texture and land cover maps of the Dender catchment were available through the Flanders Geographical Information Agency. These data were converted to grids with a resolution of 50 m for the subcatchments of the Bellebeek and the Wolfputbeek, which are used for the hydrologic model setup as described in section 4.
2.5.Scintillometer Data
The scintillometer used in this experiment is a large aperture scintillometer (LAS), type BLS2000 (Scintec AG, Tuebingen, Germany) with an aperture size of 0.26 m, suitable for fux measurements on a relatively large spatial scale (up to 10 km) reducing saturation of the LAS signal. The BLS2000- transmitter consists of two disks of 878 infrared and 34 red light LEDs, which allows for a correction of absorption fuctuations. The receiver registers the transmitted intensities from both disks as well as the (co)variances of these intensities.
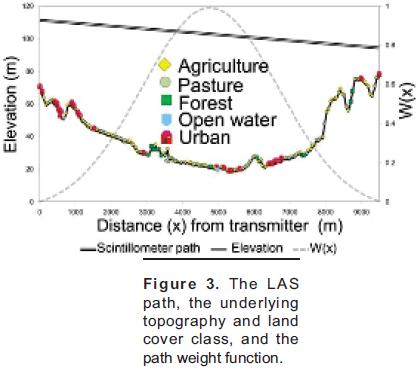
Figure 3 shows the location of the LAS path and the underlying topography and land cover class. The transmitter is situated in Asse on a water tower at an elevation of 40 m above the surface. The receiver is installed in the church tower in Eizeringen at 15 m above the surface. The LAS is installed over the subcatchment of the Bellebeek along a 9.5 km path length L. This allows the beam to cross the basin well above the canopy, the small forests, the valley of the Bellebeek, and its tributaries and roads and towns. The effective height of the beam is 68 m, calculated following the average for neutral and free convection situations, and taking into account the height above the surface using the DEM and the weighting curve of the scintillometer. From the LAS measurements, 1 min spatial average sensible heat fuxes can be derived using the calculation procedure as explained in section 2.3.2. The resulting fuxes are then averaged to a time step of 1 h.
For the present study, scintillometer measurements from 21 February 2008 through 28 August 2009 were available. Due to logging problems, no data were available for three periods: from 1 August 2008 through 25 September 2008, from 3 March 2009 through 1 April 2009, and from 9 June 2009 through 2 July 2009. In total, 447 days with scintillometer measurements were available, and a complete annual cycle has been monitored.
3.THE FOOTPRINT ANALYSIS
When air fows over an area consisting of patches with different properties (e.g. surface roughness, surface temperature, or soil moisture), internal boundary layers (IBLs) develop within the surface layer, assuming the horizontal extent of the patches is relatively small. The top of each IBL becomes diffuse as the fow encounters new surface conditions, meaning that the vertical extent of each IBL depends on the horizontal size of each patch. At a certain level above the top of the IBLs, the blending height, the signatures of the individual patches tend to merge due to turbulent mixing.
When scintillometer measurements are made over a heterogeneous terrain, a portion of the upstream surface, the source area, infuences the sensor. A scintillometer measuring above the blending height will 'see' a single area-averaged surface fux of momentum, heat, and water vapor. The question is whether the sensible heat fux from the source area measured by the scintillometer is representative for the entire region around the scintillometer, and, in extensu, the entire catchment.
Therefore, the source areas from the scintillometer are determined for every time step (section 3.2) and overlayed with the modeled sensible heat fux images in order to calculate the modeled sensible heat fux within the footprint. This heat fux can then be compared to the scintillometer measurement on the one hand (HLAS), and to the modeled catchment-averaged sensible heat fux on the other hand. Thus, if the scintillometer- measured HLAS is approximately equal to the footprint- modeled fux, but not to the modeled catchment- averaged fux, then the scintillometer measurement is not representative for the entire catchment, but only for its source area. In this case, the scintillometer sees the individual patches and is measuring under the blending height. On the contrary, if the scintillometer-measured HLAS is approximately equal to the modeled catchment-averaged H, then it could be concluded that the scintillometer measures a single area-averaged heat fux for an entire region (the catchment) around the scintillometer and is thus measuring above the blending height.
Assuming the scintillometer sees an area-averaged heat fux from the area around the scintillometer path, a footprint analysis would not be necessary to compare the model results to the scintillometer measurements of the sensible heat fux. Therefore, in a second analysis, only the modeled sensible heat fuxes from a rectangular area (1000 m wide as this can be assumed the typical footprint length) beneath the scintillometer path are compared to the scintillometer-measured and catchment- averaged H. In this paper, the footprint model of Hsieh et al. [2000] is used.
4.THE HYDROLOGIC MODEL
The land- surface model used in this study, the TOP- MODEL- based land- atmosphere transfer scheme (TOPLATS), has as its foundation the concept that shallow groundwater gradients set up spatial patterns of soil moisture that infuence infltration and runoff during storm events, and evaporation and drainage between these events. The assumption is made that these gradients can be estimated from local topography (through a soil-topographic index [Sivapalan et al., 1987]). From this foundation, the model was expanded to include infltration and resistance- based evaporation processes, a surface vegetation layer, a surface energy balance equation with an improved ground heat fux parametrization, and the effect of atmospheric stability on heat fuxes. The surface energy balance equation is solved through an iteration for the soil surface temperature.
The model was originally developed to simulate the surface water and energy balance for warm seasons. Afterwards, winter processes (frozen ground and a snow pack), an improved water and energy balance scheme for open water bodies, and a two-layer vegetation parametrization were added. An overview of the test sites and feld experiments to which the model has been successfully applied can be found in Loaiza Usuga and Pauwels [2008].
5.MODEL APPLICATIONS
5.1.Model Setup
For the model applications in this study, geographical data of the catchments of the Bellebeek and Wolfputbeek are used with a resolution of 50 m. Continuous meteorological observations from the meteorological station at Liedekerke are used to force the model. These data are point measurements, but are considered to be representative for the study area. Rainfall is assumed to be uniformly distributed over the entire catchment, so rainfall observations from the station of Liedekerke are used as model input. In addition to the meteorological variables measured at the meteorological station at Liedekerke, TOPLATS requires continuous series of incoming shortwave and downwelling longwave radiation as input. The down- welling longwave radiation was calculated from the air temperature and humidity data at the Liedekerke station. A continuous series of incoming shortwave radiation was calculated from the net radiation measurements at Liedekerke as follows. From 15 August 2007 through 30 April 2008, incoming shortwave radiation measurements were available at the BREB station in Gooik and compared to the net radiation measurements in Liedekerke. Although cloud cover can change considerably within the catchment and the long-wave radiation balance over different seasons is not constant, a linear regression between the net radiation measured in Liedekerke and this shortwave radiation revealed a correlation coeffcient of 0.96. This indicates that the relationship between these two measurements can be expressed by a linear equation. This relationship was then applied to the net radiation measured at Liedekerke throughout the study period, through which a continuous time series of incoming solar radiation could be generated.
Simulations were initiated on 1 August 2006, using an hourly time step, through 28 August 2009.
5.2.Model Calibration and Validation
TOPLATS needs numerous parameters that should be estimated. Because of the large number of pixels inside the catchments of the Bellebeek and the Wolfputbeek (60348) for which the water and energy balances are solved for a large number (27297) of time steps, huge computational resources would be required for an automatic calibration, where a large number of simulations need to be performed. Therefore, no automatic calibration has been performed, but parameter values for the TOPLATS model in this study were chosen based on literature and expert knowledge.
The estimation of the parameters for base fow (subsurface fow at complete saturation, exponential base fow coeffcient, and initial average depth of groundwater table) were calibrated manually within the ranges that are physically acceptable.
During the calibration and validation process, TOPLATS is not only evaluated on its ability to
model the catchment-averaged water balance by means of a comparison of observed and modeled catchment discharge, but also evaluated on its feasibility to model the energy balance at the pixel scale. Therefore, the observed and modeled terms of the energy balance at the BREB stations in Gooik and Ternat were evaluated.
5.2.1.Calibration and Validation of the Catchment Discharge
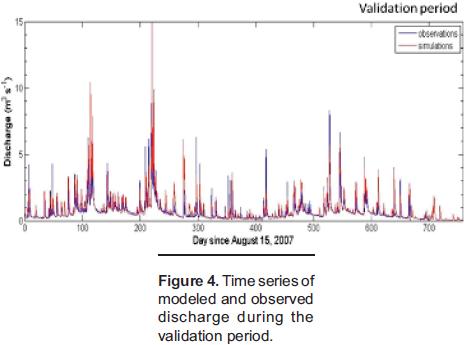
At the outlet of the Bellebeek catchment, modeled and observed discharge can be compared. The period preceeding the study period (1 August 2006 through 14 August 2007) was used as the calibration period. For the period from 15 August 2007 through 28 August 2009, the model has then been validated using the discharge at the catchment outlet.
5.2.2.Validation of the Energy Balance at the BREB Stations
At the Bowen- ratio energy balance (BREB) stations in Gooik and Ternat, net radiation, and soil, latent, and sensible heat fuxes were measured. These terms of the energy balance are used to further validate TOPLATS at the point scale. As net radiation and soil heat fux are mainly vertical fuxes, and do not have their main origin from horizontal processes, measured values of the net radiation and ground heat fux can be directly compared to modeled values at the model pixel where the BREB stations are located. For validation of the net radiation and soil heat fux, 6666 and 8560 time steps were available for Gooik and Ternat, respectively.
On the contrary, sensible and latent heat fuxes are infuenced by vertical as well as horizontal processes (mainly by the wind along the surface). For this reason, measured fuxes cannot simply be compared to modeled fuxes from the BREB pixel. For a successful comparison of the modeled latent and sensible heat fuxes to the measurements of the BREB stations, it is necessary to know the composition and extension of the upwind source area. Therefore, a footprint analysis is performed for every time step based on measurements of wind speed, wind direction, measured sensible heat fux, air temperature, and measuring height. For simplicity and analogy with the LAS footprint approach, the same fux footprint function as for the LAS, using the Hsieh analytical model [Hsieh et al., 2000] (equation (9)) is used where the measuring height is taken as 2 m, the height of the upper capacitive probe. In combination with the wind direction, the source area around the BREB stations was determined for every hourly time step. For the evaluation of the sensible and latent heat fuxes, only daytime time steps (9:00-16:00) were evaluated in the validation process when valid, positive Bowen ratios and thus positive sensible heat fuxes were measured by the BREB stations, and no precipitation occurred. The energy balance terms are only validated for these conditions because these are the conditions where valid sensible heat fuxes from the scintillometer are obtained in this study. From the time steps where data were available, 16.8% could be used for validation of H and LE (or 1124 out of
6666 time steps for Gooik and 1437 out of 8560 time steps for Ternat).
5.3.Modeled Sensible Heat Fluxes
5.3.1.Modeled Sensible Heat Flux From Footprint
From the available data sets, a selection was made of the time steps (hours) when on the one hand a sensible heat fux was available from the scintillometer measurements (daytime, unstable conditions, no precipitation), and on the other hand when enough extra meteorologic data (wind direction) were available to calculate the footprint. For these time steps, images (resolution 50 m) of the sensible heat fux simulated by TOPLATS were overlayed with the footprint images (resolution 50 m) in every pixel in order to calculate the modeled sensible heat fux within the footprint. Only footprints that are entirely within the catchment boundaries were considered because no model results for pixels outside the catchment are available.
5.3.2.Modeled Sensible Heat Flux From the Catchment
The hourly values of the modeled sensible heat fux over the footprint can then be compared to the sensible heat fux over the entire catchment.
5.3.3.Modeled Sensible Heat Flux From the Area Around the Scintillometer Path
For further analysis, modeled sensible heat fuxes from a rectangular area around the scintillometer path are also calculated. From the modeled sensible heat fux images, the weighted sensible heat fux is determined for an area of 1000 m wide (which can be considered as the typical footprint length) around the scintillometer path and taking into account the weighting factor according to the location between the LAS transmitter and receiver.
6. RESULTS AND DISCUSSION
6.1.Calibration and Validation of the Hydrologic Model
Figure 4 shows the comparison of the model to the observed discharge data for the validation period. In general, a good agreement has been obtained with regression lines close to the 1:1 line. These results have been obtained using a value of 1.5 m for the initial water table depth, 3 m-1 for the exponential decay parameter, and 10 m3s-1 for the base fow at saturation.
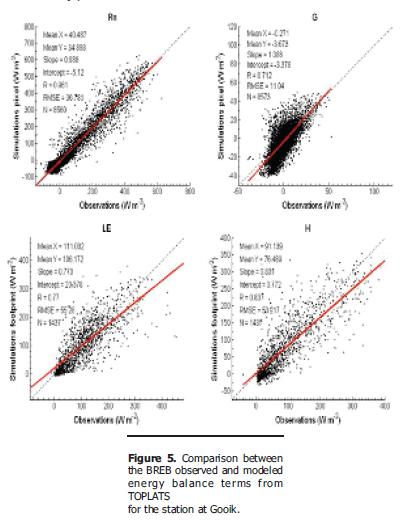
Figure 5 shows the comparison of the modeled energy balance components from TOPLATS to the observations from the BREB station in Gooik. Similar results are obtained for the BREB station in Ternat.
In general, a small bias and small RMSE values for all the energy balance terms in both stations have been obtained. Furthermore, the high R values and the fact that almost all points are within the 95% confdence bounds around the regression line, indicate that the model succeeds in modeling the energy balance terms reasonably well. Only for the station in Gooik, the scatter is larger, but this can be due to its location further away from Liedekerke. In Gooik there is sometimes a different cloud and rain structure as compared to Liedekerke, which can cause the larger scatter for all energy balance terms. Nevertheless, from the calibration and validation results of the catchment discharge and the validation of the energy budget at the point locations in Gooik and Ternat, it can be concluded that TOPLATS simulates the water and energy balance very well. Moreover, the validation of the discharge shows that TOPLATS is able to simulate the integrated water and energy balances of the entire catchment, while the validation of the energy balances at the BREB stations indicates that TOPLATS performs very well at the pixel scale. The TOPLATS results can thus be used to estimate the sensible heat fuxes at every point in the catchment in order to compare the results to the scintillometer measurements (section 6.2).
6.2.Sensible Heat Fluxes Across Large Distances
6.2.1. Scintillometer H Versus TOPLATS H
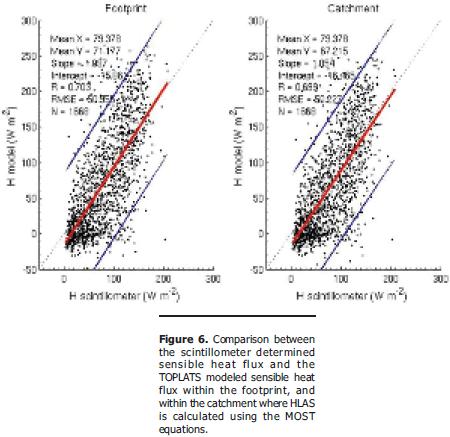
In Figure 6 the modeled sensible heat fuxes within the footprint are compared to the scintillometer-determined H based on the MOST equations. It is clear that for unstable conditions during this experiment the free convection approach is a very good approximation for the calculation of H from scintillometer data using the MOST equations. In other words, when the LAS height is considerable it is expected under unstable conditions that the infuence of mechanically produced turbulence is small and therefore, the free convection approach is a good approximation of H.
The scatterplots in Figure 6 show that generally the sensible heat fux from the scintillometer data are in accordance with the model results. However, one can see some underestimation of H by the scintillometer for the high H values (larger than approximately 150 Wm-2) and some overestimation by the scintillometer for the lower modeled H values (lower than approximately 50 Wm-2).
An explanation for the deviations between measured and modeled sensible heat fuxes can be found on both sides: the model and/or the scintillometer measurements. On the one hand, it is possible that the model provides slightly biased sensible heat fuxes for vegetation classes that were not calibrated/validated by point measurements (e.g., trees and forest, urban, etc.) and when aggregating these values in footprint-modeled H, this might lead to an error of the sensible heat fux within the footprint/catchment. On the other hand, the scintillometer-derived sensible heat fuxes from measurements at 68 m sometimes underestimate the modeled fuxes. Different explanations are available for the underestimation of the surface H from the scintillometer measurements at 68 m. First, there is the saturation effect. Second, due to the large height of the LAS path, the observations are not always located in the surface layer and as such they are not equal to the surface fuxes (as calculated with TOPLATS). The surface layer is defned as the lowest 10% of the boundary layer. In this layer the turbulent fuxes are assumed almost constant with height and this layer is called the constant fux layer. As the surface layer changes throughout the day, the scintillometer path at 68 m is not always within the surface layer and lower sensible heat fuxes are measured at the scintillometer height than actually present at the surface. Third, the overestimation of the scintillometer H compared to the TOPLATS H during winter can be attributed to the fact that there are possible limitations concerning the applicability of the similarity equations resulting in scintillometer- derived H values that are higher than the ones calculated by the model in winter periods.
Additionally, the scatter between model H and scintillometer H for low fuxes is also infuenced by the fact that atmospheric stability cannot be judged from the scintillometer data, but is judged based on a ground (Bowen- ratio) station and daytime hours. Because the scintillometer beam is at considerable height above the surface, it is possible that for time steps where near the ground unstable conditions occur, at 68 m stable conditions still occur (and vice versa) and that scintillometer-determined fuxes (based on a fT for unstable conditions) are not a good estimate for the fuxes near the ground (as modeled by TOPLATS). This can, e.g., be the case in Figure 6 where from the scintillometer- data high values for H are calculated (based on fT for unstable conditions), while TOPLATS simulates only low values, indicating that at the surface stable conditions probably occurred. As these conditions occur frequently in winter, this can be an explanation of the overestimated H values by the scintillometer in winter.
Other possible explanations for the deviation between model H and scintillometer H might be the uncertainty of the Monin-Obukhov stability functions (fT) and the nonfulflled assumptions of the MOST theory (stationarity and fat, homogeneous surface) or maybe the nonlinearity between fuxes and structure parameters.
Nothwithstanding the described considerations about the model and the retrieved sensible heat fuxes from scintillometer data, there is an overall good agreement between modeled and measured H (especially in spring and summer). This is illustrated in the scatterplots in Figure 6 by a slope of approximately 1, an R value of 0.7, and almost all points within the 95% confdence bounds.
6.2.2.Representativeness of Scintillometer Measurements
To assess the representativeness of the scintillometer measurements, a model analysis has been performed where the modeled H from the footprint is compared to the modeled H within a box around the scintillometer path and to the modeled catchment averaged H.
It is true that the scintillometer might slightly underestimate or overestimate the (modeled) surface sensible heat fuxes as is described in section 6.2.1. Also, the footprint model might not calculate the exact footprint (because of different footprint models, or even different parametrizations within the used footprint model would yield different source areas). However, the impact of these objections can be considered to be small as compared to the impact of other uncertainties in the fux measurements and modeling.
When analyzing the modeled sensible heat fux from the footprint. or the area around the path a good resemblance can be found with the modeled catchment averaged sensible heat fux (slopes and R values of approximately 1).
From these results, it can be concluded that for this experimental setup, where sensible heat fux is measured over a distance of 9.5 km, the infuence of the individual, different patches (which all have different properties due to different land cover, topography, soil type, etc.) cannot be observed in the value of the sensible heat fux over the large distance. So, it seems that the scintillometer measurement over a distance of 9.5 km in the Bellebeek catchment is representative for the scintillometer path, the footprint, and in extensu for the entire catchment (for daytime, unstable conditions).
6.2.3. Sensible Heat Fluxes From Scintillometer Data Compared to BREB Observations
Next to the comparison between HLAS and HTOPLATS, the sensible heat fuxes from the scintillometer can be compared to the Hs from the Bowen-ratio energy balance stations (Gooik and Ternat). Again, only hourly, daytime (9:00-16:00) time steps when valid, positive Bowen ratios were measured by the BREB stations and no rainfall occurred were taken into account. In this analysis, scintillometer- derived H values from the MOST equations are considered.
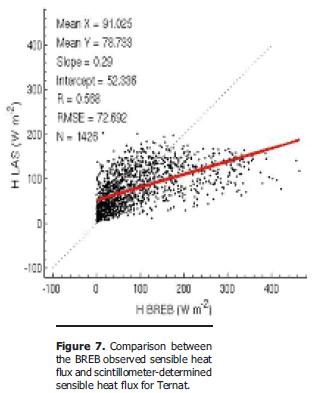
From the scatter plots in Figure 7, it is clear that the sensible heat fuxes from the BREB stations are not comparable to the fuxes as determined from scintillometer measurements. This can be ascribed to the fact that the scintillometer in the Bellebeek catchment is placed at considerable height above a heterogeneous surface over a propagation path of 9.5 km, while the BREB stations are measuring the sensible heat fux at point locations near the ground (2 m). As such, the sensible heat fuxes observed by the scintillometer are area-averaged fuxes that are not comparable to the sensible heat fuxes measured by the BREB stationsabove mainly grassland or pasture.
The important conclusion is that BREB measurements from ground stations as in this experiment cannot be used as an estimate for the sensible heat fux of a large heterogeneous area as a catchment, or
for the validation of the scintillometer signal. BREB measurements can only be considered to be representative for the source area surrounding the BREB station.
7.SUMMARY AND CONCLUSIONS
In this paper, scintillometer measured sensible heat fuxes across a distance of 9.5 km over a heterogeneous catchment of approximately 102.3 km2 have been validated, and a footprint analysis has been performed, in order to determine the representativeness of scintillometer measurements.
As a frst step, a land surface model has been calibrated and validated using discharge and energy balance terms. Good agreement between measurements and model results has been achieved. Good correspondence between observed and modeled discharge shows the accuracy of the model at the catchment scale. The accuracy of the model at the point scale is illustrated by the ability to simulate net radiation and soil heat fux at the pixel where BREB stations were located, and latent and sensible heat fux from the source areas around the BREB stations.
Second, the model results are used in a footprint analysis in order to calculate the modeled sensible heat fuxes in the footprint, and to compare them to the scintillometer derived sensible heat fuxes. In general, the sensible heat fuxes from the LAS compared well to the modeled sensible heat fuxes within the footprint. It should however be mentioned that the scintillometer might underestimate the higher H fuxes. Explanations for this underestimation can be the saturation effect, fux divergence, the uncertainty of the Monin- Obukhov stability function(s), the nonfulflled assumptions of the MOST theory, and the nonlinear relationship between fuxes and structure parameters. Some overestimations of the lower sensible heat fuxes may be due to the (non)applicability of the similarity equations or the judgment of (un)stable conditions, which is diffcult, especially for winter months.
From this experiment, it can be confrmed that for unstable conditions the free convection approach is a good approximation for the calculation of scintillometer H when the scintillometer is measuring at a considerable height.
Third, the modeled sensible heat fux from the footprint is very similar to the catchment averaged sensible heat fux. This led to the conclusion that the scintillometer measurements over a distance of 9.5 km and an effective height of 68 m are representative for the entire catchment (102.3 km2). A such, this study is a proof of the suggestion of De Bruin et al. [1995] who stated that area- averaged H fuxes can be obtained for an area of 10 x 10 km2 using a scintillometer over a path length of approximately 10 km.
Finally, from the comparison of the scintillometermeasured H and the BREB- measured H, it is clear that point measurements over a homogeneous surface cannot be assumed to be representative for a heterogeneous catchment as the Bellebeek catchment. Overall, for this experiment, the scintillometer over 9.5 km can be used to estimate the sensible heat fux for a large area, and in extensu, the sensible heat fux for a catchment of about 100 km2.
References
Hsieh, C. I., Katul, G. and Chi, T. W., 2000. An approximate analytical model for footprint estimation of scalar fuxes in thermally stratifed atmospheric fows, Adv. Water Resour., 23 (7), 765- 772.
Loaiza Usuga, J. C. and Pauwels, V. R. N., 2008. Calibration and multiple data set- based validation of a land surface model in a mountainous Mediterranean study area, J. Hydrol., 356 (1- 2), 223- 233.
Sivapalan, M., Beven, K. and Wood, E. F., 1987. On hydrologic similarity, 2, A scaled model for runoff prediction, Water Resour. Res., 23 (12), 2266- 2278, doi:10.1029/WR023i012p02266.
Cómo citar
APA
ACM
ACS
ABNT
Chicago
Harvard
IEEE
MLA
Turabian
Vancouver
Descargar cita
Visitas a la página del resumen del artículo
Descargas
Licencia
Derechos de autor 2011 Gestión y Ambiente

Esta obra está bajo una licencia internacional Creative Commons Atribución-NoComercial-CompartirIgual 4.0.
Los artículos que sean publicados en la revista Gestión y Ambiente, también serán publicados en el sitio web http://www.revistas.unal.edu.co/index.php/gestion/index y en formatos electrónicos como PDF, HTML, XML, entre otros. Además, en diferentes redes sociales de difusión del conocimiento. Gestión y Ambiente adopta directrices de ética por Committee on Publication Ethics (COPE) sobre buenas prácticas de conducta (evitar conductas como plagio, falsificación, autoría ficticia, entre otros), describe conflictos de interés o en competencia, contribuciones de autoría y fuentes de financiación. Todo lo publicado se considerará propiedad de la revista Gestión y Ambiente, pero pueden usarse bajo la licencia Creative Commons “Reconocimiento-No Comercial-Compartir Igual International (BY-NC-SA) 4.0”


