


Publicado
The Effects of the Global Financial Crisis on Brazilian Banking Efficiency
Los efectos de la crisis financiera internacional en la eficiencia bancaria brasilera
Os efeitos da crise financeira internacional na eficiência bancária brasileira
DOI:
https://doi.org/10.15446/innovar.v24n53.43772Palabras clave:
DEA, Brazil, Banking, Financial Crisis, efficiency, BRIC economies, Quiet life (en)DEA, Brasil, bancario, crisis financiera, eficiencia, economías de BRIC vida tranquila (es)
DEA, Brasil, bancário, crise financeira, eficiência, economias do BRIC, vida tranquila (pt)
Descargas
The effects of the global financial crisis on brazilian banking efficiency
Los efectos de la crisis financiera internacional en la eficiencia bancaria brasilera
Les effets de la crise financière internationale sur l'efficience bancaire brésilienne
Os efeitos da crise financeira internacional na eficiência bancária brasileira
Mark Edward WoltersI; Eduardo Barbosa Do CoutoII; José Augusto FelícioIII
I Visiting assistant Professor, University of Illinois. Champaign, IL, USA. E-mail: mwolter@illinois.edu
II Associate Professor, School of Economics and Management (ISEG), Technical University of Lisbon. Champaign, IL, USA. E-mail: ecouto@iseg.utl.pt
III Adjunct Professor, School of Economics and Management (ISEG), Technical University of Lisbon. Champaign, IL, USA. E-mail: jaufeli@iseg.utl.pt.
Correspondencia: 350 Wohlers Hall, 1206 south sixth street. Champaign, IL 61820, USA.
Citación: Wolters, M.E., Barbosa, E. & Felicio, J.A. (2014). The effects of the Global Financial Crisis on Brazilian Banking efficiency. Innovar, 24(53), 23-39.
Clasificación JEL: G14, G21, N16.
Recibido: Junio 2013; aprobado: Noviembre 2013.
Abstract:
With Brazil and the BRIC economies becoming more important to world growth and financial investment, it is important to understand the inner-workings of the financial institutions that will help spur on continued economic growth. This article focuses on the recent history of the market structure of the Brazilian banking sector as well as the effects of the global financial crisis of the late 2000s on the overall relative efficiency of the Brazilian banking sector by using data envelopment analysis. The period studied-2002-2011-shows a Marked decrease in overall relative efficiency in the Brazilian banking sector. The negative effects were felt across the board regardless of bank size or ownership type. Small and medium sized banks had the most significant drop in relative efficiency while larger banks were able to weather the crisis more successfully. This alludes to the idea that "Bigger is Better" when dealing with financial shocks to banking efficiency, and would allow us to summarize that the Brazilian banking sector is not participating in the "Quiet life" of concentrated markets. Also, looking at ownership type, the study shows that Brazilian banks that are controlled by the government were ranked as the most efficient types of banks. Their foreignowned counterparts, however, were ranked as the least efficient and had a larger drop in overall efficiency and participation during the financial crisis than their domestic Brazilian counterparts. The article contributes to the continued need for more information on the Brazilian banking sector's history and development.
Keywords: DEA, Brazil, Banking, Financial Crisis, efficiency, BRIC economies, Quiet life.
Resumen:
Dado que las economías de Brasil y de BRIC son cada vez más importantes para el crecimiento mundial y la inversión financiera, es importante entender el funcionamiento interno de las instituciones que ayudarán a impulsar un crecimiento económico continuo. Este artículo se enfoca en la historia reciente de la estructura de mercado del sector bancario de Brasil, así como en los efectos de la crisis financiera internacional de finales de la década de 2000 en la eficiencia relativa general del sector bancario brasilero, usando análisis envolvente de datos. El período estudiado, 2002-2011, muestra una pronunciada disminución de la eficiencia relativa general en el sector bancario brasilero. Los efectos negativos se sintieron en todo el sector, independientemente del tamaño del banco o de la forma de propiedad. Los bancos pequeños y medianos tuvieron la caída más significativa en eficiencia relativa, mientras que los bancos de mayor tamaño pudieron sobrellevar mejor la crisis. Esto alude a la idea de que "entre más grande mejor" cuando se trata de lidiar con choques financieros a la eficiencia bancaria, y nos permite resumir que el sector bancario brasilero no participa en la "vida tranquila" de los mercados concentrados. Así mismo, al considerar el tipo de propiedad, el estudio muestra que los bancos brasileros que están controlados por el gobierno estuvieron catalogados como los más eficientes. Sus contrapartes de propiedad extranjera, por otro lado, fueron catalogados como los menos eficientes y tuvieron una mayor caída en su eficiencia general y participación durante la crisis financiera que los bancos brasileros. El artículo contribuye a la continua necesidad de conocer más información sobre la historia y el desarrollo del sector bancario brasilero.
Palabras clave: DEA, Brasil, bancario, crisis financiera, eficiencia, economías de BRIC vida tranquila.
Résumé:
Etant donné que les économies du Brésil et des Bric sont tou jours plus importantes pour la croissance mondiale et l'investissement financier, il est important de comprendre le fonctionnement interne des institutions qui aident à impulser une croissance économique continue. Cet article est centré sur l'histoire récente de la structure de marché du Secteur bancaire du Brésil ainsi que sur les effets de la crise financière internationale de la fin des années 2000 sur l'efficience relative générale du secteur bancaire brésilien, en utilisant une analyse enveloppante de données (DEA). La période étudiée, 2002-2011, montre une diminution prononcée de l'efficience relative générale dans le secteur bancaire brésilien. Les effets négatifs se sont fait Sentir dans tout le secteur, indépendamment de la taille de la banque ou de la forme de propriété. Les banques petites et moyennes ont connu la chute la plus significative en efficience relative, tandis que les banques d'une plus grande importance ont mieux pu faire face à la crise. Cela renvoie à l'idée que « Plus grand, c'est mieux » quand il s'agit de faire face à des chocs financiers touchant l'efficience bancaire, et nous permet de résumer que le secteur bancaire brésilien ne participe pas à la « Vie tranquille » des marchés concentrés. Ainsi, à considérer le type de propriété, l'étude montre que les banques brésiliennes contrôlées par le gouvernement peuvent être cataloguées comme les plus efficientes. Leurs contreparties de propriété étrangère, par ailleurs, ont été cataloguées comme les moins efficientes et ont connu une chute plus grande dans leur efficience générale et participation pendant la crise financière que les banques brésiliennes. L'article contribue au besoin continuel d'avoir plus d'information sur l'histoire et le développement du secteur bancaire brésilien.
Mots-clés: DEA; Brésil; bancaire; crise financière; efficience; économie des BRIC; vie tranquille.
Resumo:
Levando em conta que as economias do BRIC são cada vez mais importantes para o crescimento mundial e o investimento financeiro, é importante entender o funcionamento interno das instituições que ajudarão a impulsionar um crescimento econômico sustentável. Este artigo está focado na história recente da estrutura de mercado do setor bancário do Brasil, bem como nos efeitos da crise financeira internacional do final da década de 2000, na eficiência relativa geral do setor bancário brasileiro, usando uma análise envolvente de dados. O período estudado, 2002-2011, mostra uma pronunciada diminuição da eficiência relativa geral no setor bancário brasileiro. Os efeitos negativos foram sentidos em todo o setor, independentemente do tamanho do banco ou da forma de propriedade. Os bancos pequenos e médios tiveram a queda mais significativa em eficiência relativa, enquanto os bancos de maior tamanho puderam enfrentar melhor a crise. Isto se refere à ideia que "Quanto maior, melhor", em se tratando de lidar com choques financeiros à eficiência bancaria, e nos permite resumir que o setor bancário brasileiro não participa na "vida tranquila" dos mercados concentrados. Igualmente, ao considerar o tipo de propriedade, o estudo mostra que os bancos brasileiros que estão controlados pelo governo foram classificados como os mais eficientes. As suas congêneres de propriedade estrangeira, por outro lado, foram catalogados como os menos eficientes e tiveram maior queda na sua eficiência geral e participação durante a crise financeira do que os bancos brasileiros. O artigo contribui para a contínua necessidade de conhecer mais informação sobre a história e o desenvolvimento do setor bancário brasileiro.
Palavras-chave: DEA, Brasil, bancário, crise financeira, eficiência, economias do BRIC, vida tranquila.
Introduction
As many national banking systems around the world were adversely affected by the financial crisis regardless of their participation in so called subprime mortgages or risky loan behavior, it is important that we analyze how banking systems work in various countries in order to better understand the lead up to and the after-effects of the world financial crisis on their financial systems. Additionally, with the limited amount of published data on BRIC financial systems and on the negative effects of the crisis, particularly Brazil, as compared to other economies such as the Us or the European Union, the authors felt it important to research this area. Therefore, the objective of this paper is to better understand the recent history of the Brazilian banking sector as well as to study the impact of the global financial crisis on the overall relative efficiency of the Brazilian banking sector from 2002 to 2011 in order to contribute to the need for expanded information on the Brazilian banking sector, its history, how the crisis effected the sector, and how efficiency developed over the time period.
The 2002-2011 period showed a noticeable decrease in foreign participation in the Brazilian banking sector in terms of assets, loans, liabilities and number of foreign owned banks. And, by using data envelopment analysis (DEA), the study showed that the relative efficiency of Brazilian banks had a Marked decrease during the financial crisis period 2007-2010. The negative effect on banking efficiency was felt by all types of banks regardless of ownership type or size of holdings. The negative effects of the crisis were most dramatic on small and medium sized banks that did not have the financial reserves to withstand the crisis. Thus, the data alludes to the "Bigger is Better" analogy for banks trying to weather difficult financial times. It is noteworthy that the negative efficiency developments began two quarters before the fall of Lehman Brothers Bank, which many feel was the beginning of the global crisis, and, by 2011, the entire sector had begun to recover the relative efficiency loss due to the crisis.
Furthermore, Brazilian public banks (those owned by the Brazilian Government) were ranked as the most efficient while their foreign-owned counterparts were ranked the least efficient. Moreover, the data states that large banks in Brazil are the most efficient banks overall and they increased their overall efficiency gap between their small and medium sized competitors during the time period. Taken together with their ability to withstand the global financial crisis, we found that the Brazilian banking sector is not participating in the "Quiet life" scenario of concentrated markets.
The article continues, in section 2, with some background on the Brazilian banking sector. Section 3 provides a literature review on efficiency measures, section 4 explains the data set and methodology used in the study, section 5 presents our findings and section 6 provides a number of conclusions from our findings.
Background on Brazilian Banking
The past twenty years have been Marked by reform, new regulations, foreign investment, new bank entry and exit, privatization, consolidation, and changes in competition and efficiency in the Brazilian banking sector. Additionally, the banking system in Brazil allows for banks to operate in multiple areas of financial activity. They can combine the activities of commercial, investment, development, leasing, and mortgage lending banks into a conglomerate bank.
When focusing on the Brazilian government's participation, influence and instituted changes in the Brazilian banking sector, the first step in these series of changes was the Real Plan. This was a major stabilization plan developed by the Brazilian government in order to reign in years of runaway inflation1 and fiscal irresponsibility. The Real Plan used a semi-fixed exchange rate in conjunction with more open trade and investment policies. The Real Plan gave some Leeway in its exchange pattern as was seen after the Mexican crisis in 1994-1995 when the Brazilian government began to allow the Real to devalue little by little. This led to a full free float of the Real in 1999, after a period of intense speculative pressure on the currency leading up to the free float (de Paula and Alves, 2003). After the free float of the Real, the government focused on inflation targeting. This inflation targeting helped maintain single digit inflation even after the free float, and it continues to do so today.
According to the Brazilian government, the inflation rate in 1994 was 2,240% and by 1998 it had fallen to 4.85%. In the year 2000, after the floating of the Brazilian Real, inflation stayed at a respectable 8.03% even with the added pressure of the ending of the true semi-fixed exchange rate portion of the Real Plan in 1999. This stabilization of inflation has continued throughout the study with inflation rates between 4-6% for the late 2000s. There was a slight increase in inflation during the argentine financial crisis of 2002/2003 and a brief upturn in inflation at the beginning of the 2008/2009 financial crisis.
Before the Real Plan, Brazilian banks made a profit from inflation charges. Inflation charges are felt by non-interest bearing deposits and cash deposits. Since the banks are the issuers of the deposits they receive a part of the inflation charges. This charge was a significant percentage of Brazilian banks' profits. In the early 1990s, inflation charges for banks accounted for 3.4% of GDP (Nakane & Weintraub, 2005). However, after the instatement of the Real Plan and Brazil changing from a high inflation country to a low inflation country, the inflation charges as a percentage of GDP dropped to 0.03% in 1995 (De Paula & Alves, 2003).

There were two further effects of the high inflation rates. First, the over branching of banks as they opened up extensive branch networks in order to obtain deposits as soon as possible to limit the negative effects of the high levels of inflation. The second and more positive effect was a high level of investment in information technology. This investment was made in order for the banks to be able to quickly clear inter-bank balances so as to suffer the least amount of negative effects from the high levels of inflation. This helped to institute more efficient bank transactions throughout the banking system (Lucinda, 2010).
The increase in bailouts along with other financial and economic problems led to additional measures being taken by the Brazilian government in order to reign in some of the inefficient state banks within Brazil as well as inefficient and unsafe private banks. These measures set out to facilitate the exit or purchase of inefficient or risky banks. Belaisch (2003), Beck, Crivelli and Summerhill (2005), Neto, Araujo and Ponce (2005), and Nakane and Weintraub (2005) take a specific look at the transformations in the Brazilian banking sector from before the Real Plan to after the deflation of the Brazilian Real (Roughly the period 1990-2002).
The two main programs set forth by the government to shore up public and private banks were PROES (Program of incentives to the Reduction of the state-level Public sector in Bank activity) and PROER (Program of incentives to the Restructuring and strengthening of the national Financial system).
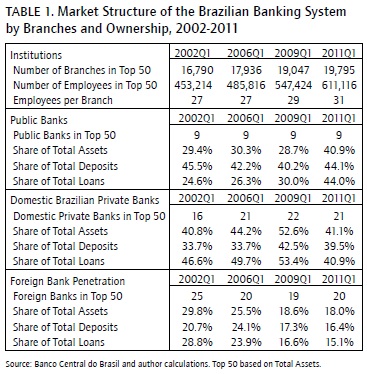
Within PROES, a state bank had essentially five choices. The first choice was to leave the market completely through liquidation. Second, the bank could allow the federal government to take control and privatize or liquidate the bank. Third, the bank could privatize on its own. Fourth, the bank could be restructured and continue running as a state bank. There was a further fifth option of turning the bank into a developmental agency (Beck, Crivelli & Summerhill, 2005). These criteria set by the federal government were meant to force states' hands in the matter and make them privatize their banks. With that purpose in mind, the PROES was successful due to the fact that in 2002 there were only 14 of the original 32 public banks remaining in operation from 1994. Of those 14 banks, 9 were ranked in the top 50 in terms of total assets in 2002 and in the first quarter of 2002, they held 29.4% of total assets, 45.5% of total deposits, and 24.6% of total loans. For a more detailed look at the market structure progression see table 1.
Private sector banks were compelled to change ownership structure and business style by the PROER program in 1995 (Program of incentives to the Restructuring and strengthening of the national Financial system). Under PROER, weak, inefficient or threatened banks had the option to either increase their capital, transfer shareholder control or be merged with another bank. In order to facilitate the transition and sales of the weaker private banks the central bank enacted measures to make it easier for stronger banks to purchase their weaker competitors (Nakane & Weintraub, 2005).
The PROER program saw a dramatic decrease in the number of private domestic banks within Brazil, from 146 in 1994 to only 75 in 2002, of which 16 were among the top 50 universal banks. This drop in real numbers of banks did not mean a drop in the share of the banking market held by Brazilian domestic banks. In terms of share of deposits, domestic private banks had a 38.85% share of the market in 1993 and a 37.16% share in 2002. Additionally, their share of the loan market increased from 31.55% in 1993 to 40.45% in 2002. This increase in the loan market was due, in part, to the extreme drop off in the share of public sector banks, which fell from 61.88% of the loan market in 1993 to a mere 29.07% in 2002 (Nakane & Weintraub, 2005). Consequently, again, we could say that the PROER program was a success in what it set out to do, which was to eliminate inefficient and unsafe private Brazilian domestic banks.
With the conclusion of the Real Plan, PROES and PROER programs, some would surmise that the government would take a smaller part in other banking activities in order to allow the market to dictate rates and borrowing. However, due to the limited amount of long term loans available from private banks within Brazil the federal and state governments play a key role in long term financing projects as well as long term financing for corporations and individuals as their goals are more geared toward long term development and less toward profit maximization (Teixeira & Mollo, 2006).
In terms of foreign participation in the Brazilian market, the opening of the banking sector and ability of foreign banks to purchase Brazilian domestic banks, in correspondence with the Real Plan, led to a large investment by international banks within Brazil. With the overall banking industry consolidating from 246 banks in 1994 to 155 in 2002, the number of foreign controlled banks rose from 37 to 56 in the same time period. Additionally, the share of the market of foreign banks in terms of net worth, assets, deposits, and share of the loan market increased at an astounding rate. The share of the net worth of the Brazilian banking sector controlled by foreign banks rose from 7.3% in 1993 to 33.6% in 2002, while the share of assets rose from 8.4% to 27.7%, deposits from 4.8% to 20.1%, and share of the loan market increased from 6.6% to 30.5% (Nakane & Weintraub, 2005).
Some of the benefits enjoyed by the domestic banking client with the onset of foreign bank competition in the industry included an improved level of service, an increase in the number of financial products available to the domestic consumer and increased regulation that would allow for a more stable domestic banking environment. Also the simple presence of internationally respected banks helps countries to be able to gain access to international capital, because the international banks add credibility to the domestic banking market.
The main negative factor for the domestic banks would be the increased costs in competing against a larger international bank with a stronger reputation than the domestic bank. The domestic consumer may lose out as well, as international banks may not be as willing to offer riskier loans for smaller domestic customers (Beck et al., 2005; Claessens, Demirguc-Kunt and Huizinga, 2001).
Further studies on foreign owned banks in domestic markets have shown interesting findings. For example, foreign owned banks in the United States were shown to be significantly less efficient than their Us domestic counterparts (Chang, Hasan & Hunter, 1993; Deyoung & Nolle, 1996; Mahajan, Rangan & Zardkoohi, 1996). These studies ran through the early 1990s, when foreign banks were pushing their way into the Us banking market. Hence, we could say that the foreign banks do not bring new efficiency gains with them.
However, further research and conjecture would suggest that these non-Us and non-Brazilian banks were trading off efficiency for rapid growth in market share in ways that may not be monetarily efficient, but that do help them achieve their long term goals. The data envelopment analysis results for the 2002-2011 period shows that the foreign banks in Brazil were also less efficient than their Brazilian domestic private and public counterparts (for further discussion on efficiency in the banking sector based on ownership see the Results section below).
Regardless of the foreign banks' efficiency actions upon entering, the reforms and globalization of the financial sectors in Brazil and indeed all of Latin America throughout the 1990's, lead to a Marked increase in foreign bank participation (Yildirim & Philippatos, 2007). According to Nakane and Weintraub (2005), from 1994 to 2002 Brazil saw an increase in the number of foreign owned banks of over 150% while the total number of banks in the country fell to 63% of their number in 1994. This contrast in the success of foreign banks versus the overall consolidation of the Brazilian banking market shows that the downfall of the state and federal banks in Brazil due to PROES and the private banks due to PROER did not necessarily transfer to the foreign banks within Brazil during the initial 19942002 period.
The highs that Belaisch (2003) and Nakane and Weintraub (2005) wrote of had started to wither as from 2002. The influence of foreign banks on the top 50 banks total assets also slowly diminished over the 2002-20011 period. Foreign banks represented 50% of the top 50 banks in Brazil in Q1 2002, but only held 19 of the top 50 spots by Q1 2009. The erosion of market power did not limit itself to just the number of banks in the top 50, from a market share point2-of-view total assets declined from 29.8% in Q1 2002 to 25.5% in Q1 2006, to a further reduction to 18.6% in Q1 2009 and 18.0% in Q1 2011. Their share of the loan market fell even further starting at 28.8% in Q1 2002 to 23.9% in Q1 2006 to 16.6% in Q1 2009, to a further loss to 15.1% in Q1 2011.
The shrinkage in foreign bank participation toward the end of the study fell dramatically as some foreign banks had to re-evaluate their positions during and after the worldwide banking and financial crisis of 2008 to 2011. Still, some foreign banks had already decided to leave the market or change their participation before this crisis. For example, as Staub et al. (2010) points out Bank of America sold its Bank Boston Brazilian assets to Itau in 2006, given that they found they were having difficulties increasing their market share in Brazil. There were continued mergers and acquisitions throughout the late 2000s with the majority being larger banks buying out their smaller niche rivals (Staub, Da Silva e Souza & Tabak, 2010).
Additionally, as the market concentrated over the period, mergers and acquisitions also changed. It was no longer solely larger banks buying out their smaller competitors, they moved towards buying other larger players as well. When Unibanco merged with itau to become, briefly, the largest bank in Brazil at the end of 2008 beginning 2009, it showed that consolidation within the large banks was a possibility as well.
Literature review of efficiency measures
"The best of all monopoly
profits is a quiet life"
(Hicks, 1935, p. 8)
This quote from Hicks has been used constantly throughout economic literature to represent what some would say would be the worst part of monopoly action, that is, inaction. The "quiet life" would occur when a company has more extreme market power and thus exhibits a lower effort by managers and directors to eliminate inefficiencies. This may come about in the form of pricing above marginal costs, thus relaxing the need to reign in these inefficiencies. Therefore, there would be a negative correlation between market power and efficiency (Berger & Hannan, 1998; Casu & Girardone, 2009; Maudos & Guevara, 2007).
Berger and Hannan (1998) tested the quiet life hypothesis in concentrated and non-concentrated banking sectors and their results came up with a few noteworthy observations. In regards to marginal costs, managers may not have the same pressure to lower their costs and inefficiencies if they are in a position to use their market power. Additionally, the concentrated market may allow managers to follow non-profit maximizing goals. Finally, and maybe the worst effect of the quiet life, inefficient and incompetent managers are not held accountable for their incompetence since their weak performance is hidden by the artificial margins. Thus, they are allowed to stay in their positions continually hurting the company's profitability, efficiency and clients.
This would seem contradictory to the other structural approach best summarized by Demsetz (1973) efficient structure hypothesis, which states that firms earn market share by being more efficient in the use of their resources than their competitors and, thus, win market share from them.
Frontier analysis is a bench Marking technique where best practice firms are considered the frontier of maximum efficiency, productivity or whichever criteria they choose. The frontier that is created is then measured against other firms in the market to compare and determine their level of efficiency relative to the best-practice frontier setting firms. Frontier analysis is also easy to use given that one does not require insider information or in-depth knowledge of an industry in order to analyze it. Consequently, there is no information asymmetry that can affect the analysis of the frontier as financial data is used.
The drawback to frontier analysis is that it basically tells managers information they already know. Frontier analysis does give managers quantitative proof of what they have already observed and it can then lead them to make decisions that can correct those areas where they are behind in terms of the bench Mark competitors (Berger & Humphrey, 1997). Furthermore, the application of frontier analysis for government approval of mergers or acquisitions cannot be left out. By being able to show the different levels of efficiencies merging banks or enterprises have, they can forecast where they will be improving and, thus, validate their mergers or acquisitions.
The parametric models, stochastic Frontier analysis (SFA), distribution Free approach (DFA) and thick Frontier analysis (TFA) and non-parametric models, data envelopment analysis (DEA) and Free disposal Hull (FDH) are the most popular forms of efficiency analysis in the literature. The differences are mostly based on the assumptions that a researcher must put on the data in order to use each model. The main dividing assumptions are: 1) the restrictiveness of the functional form of the model, parametric models being much more restrictive than non-parametric models. 2) How the model deals with random error. Non-parametric models assume that there is no error in the system and that all variations come from inefficiencies and not, for example, from bad luck. Parametric models do use random error and inefficiency in their models and, thus, have different efficiency values than a similar non-parametric model. There are further differences within parametric methods by way of distribution of inefficiency and random error.
Insofar as comparing parametric and nonparametric approaches, Berger and Humphrey (1997) analyzed 130 studies on frontier efficiency analysis. They found that in general the nonparametric approach found less efficiency than the parametric approach. However, the dispersion of efficiency was greater in nonparametric than parametric frontier analysis. But, as we are more pessimistic about how efficient banks and companies in general are run, it would give us more reason to select a nonparametric approach in order to assess true efficiency in banks/companies.
When looking at the definition of efficiency, there are three main concepts of efficiency that are used throughout the literature. These were defined by Berger and Mester (1997) as Cost, Profit and alternative Profit efficiency, which allow for researchers to measure efficiency while taking into account market prices and competition instead of solely technical efficiencies. Determining which concept a study will use is vital in deciphering the results of any efficiency analysis.
In order to study efficiency in a more structured way, we can also use parametric efficiency measures. Here the researcher places specifications on the efficiency frontier. This allows for more structure and focused evaluation, with the benefit of allowing for errors in the measurements. However, if the original form of the model is specified incorrectly, the measured efficiency will be inaccurate (Berger & Humphrey, 1997).
Stochastic Frontier approach (SFA) is one parametric frontier efficiency measure that specifies a functional form for the relationship between inputs, outputs, and additional environmental factors as well as random error. Another parametric method is called the distribution free approach. DFA also uses a frontier in a functional form in order to analyze inefficiencies. DFA is slightly different from SFA due to the separation of inefficiencies and error terms. This difference is in that DFA assumes that inefficiencies/efficiencies are stable over time and random error averages out over time. A further parametric efficiency frontier technique is the thick Frontier approach. Here a functional form is specified and the derived results assume that the top and bottom performance quartiles represent random error while the interior quartiles represent inefficiencies.
Non-parametric estimation techniques evaluate technical inefficiencies in terms of banks using too many inputs to produce their output, or are producing too little output for the amount of inputs they have. The non-parametric methods focus on technical inefficiencies and, accordingly, they do not relate wholly to the cost/profit/alternative profit efficiencies that were discussed above. This is mainly due to their differences from the parametric models. The main differences can be summarized as follows: 1) they cannot account for allocative inefficiencies, 2) they cannot differentiate between levels of specialization or service provided by different banks that may influence perceived cost/profit inefficiencies, 3) With no value given for outputs, it is impossible to establish whether the output produced is optimal.
Data envelope analysis has been used to measure inefficiencies and efficiencies in different industries. Furthermore, DEA is a non-statistical method, which relies on linear programming. It provides a linear piecewise frontier by enveloping the collected data points and thus giving a convex production possibilities frontier. It gives us a measure of relative efficiency of different decision making units (DMU) (Halkos & Salamouris, 2001). Specifically nonparametric DEA focuses on the direct relationship between inputs and outputs of a business unit. This ability to deal with multiple inputs and outputs is one of DEA's main advantages versus parametric efficiency measures. Furthermore they are especially useful when dealing with group data, such as bank branches (Bos & Kolari, 2005; Camanha & Dyson, 2006; Halkos & Salamouris, 2004).
When measuring efficiency, a researcher must look at the orientation he or she wishes to use. In efficiency analysis, researchers should focus on one of two measures, either an input or output oriented measure. As discussed in Coelli (1996), input oriented measures focus on how much a firm could proportionally reduce its inputs and at the same time remain at its current level of production. The output oriented measure looks at how much a firm can proportionally increase its produced quantities while not altering the amount of input quantities it uses.
DEA was formulated by Charnes, Cooper, and Rhode in 1978 as a way of measuring efficiency of units in a system (Charnes, Cooper & Rhode, 1978). This development allowed for a relative comparison of efficiency between different units. These DMUS transform inputs such as income or resources into outputs such as services or products. Consequently, in DEA analysis, we have to be able to collect data for the same inputs and outputs for the DMUS being studied in order to make a successful comparison.
Charnes, Cooper and Rhodes (1978) developed their DEA measure in terms of constant returns to scale (CRS) which is often referred to as the CCR model. While Banker, Charnes and Cooper (1984) proposed a DEA measure in terms of variable returns to scale (VRS) which is often referred to in the literature as the BCC model. The CRS model is appropriate when all DMUS are functioning on an optimal scale; however, if there are factors in the market that may lead to non-optimal scale functioning such as imperfect competition, market shocks or other factors, then a variable Return to scale (VRV) model is more appropriate. If not all of the DMUS are producing at an optimal level then the conditions can lead CRS models to confuse technical efficiencies and scale efficiencies. On the other hand, the VRS model will allow for calculating technical efficiency without the problems of scale efficiencies as in the CRS model (Coelli, 1996).
Also, DEA weighs separate efficiency factors differently. If we analyze the weights associated with each variable in our efficiency, we can see whether a firm is focusing on just one or two of the efficiency factors or on all of them. With this, we can determine whether a firm "specializes" in a certain area of efficiency. However, as it may be very strong in one or two areas, this would give the firm an overall efficient score, while, technically, it is not efficient in other factors. So, we could still suggest improvements in banks that are deemed fully efficient (Halkos & Salamouris, 2001).
In terms of data collection, it is often difficult if not impossible to obtain certain types of data from a bank or firm, which means that we must use available data. Hence, nonparametric analyses rely on accounting data such as costs, outputs, inputs, revenues, profits and the like (Berger & Humphrey, 1997). These variables are then used to determine the bench Mark for the industry to which the banks being studied can be compared. In other words, a set of in-dices is created that can be used to compare a wide range of factors within multiple groups. This could then be used in order to compare different groups of banks within the Brazilian market, domestic versus public, versus foreign bank efficiencies.
The technical efficiencies ratios that DEA determine are equal to a weighted sum of outputs over a weighted sum of inputs. The weights are determined for each DMU by determining the efficiency frontier for the group as a whole using a maximization of the efficiency ratio so that every DMU is equal to or less than one. DMUS that lie on the frontier are termed efficient and those that do not lie on the frontier are termed inefficient (Halkos & Salamouris, 2001).
Furthermore, it is important to note that there are two main approaches to DEA in terms of banks' economic activities, the intermediation approach and the production approach. 1) intermediation approach: this DEA approach sees banks as an intermediary between those wanting to invest their funds and entities that wish to use those funds. In terms of the use of inputs and outputs, this approach considers the financial value of outputs related to deposits, loans, and securities, while, when looking at inputs, it focuses on the financial costs related to liabilities. 2) Production approach: this DEA approach sees banks as the supplier of services for depositors. Therefore this approach sees outputs consisting of the number and value of transactions over a period of time, and inputs are focused on labor and capital.
Staub et al. (2010) looked at efficiency developments in the Brazilian banking sector from 2000-2007. Using DEA analysis they were able to determine that Brazilian banks have lower cost efficiency than their European and U.S. counterparts. The authors added extra measures to DEA in order to account for cost as well as allocative and technical efficiencies. They found that public banks were the most efficient in terms of cost, technical and allocative efficiency, which would seem to go against popular theory that public banks have an agency problem. Furthermore, they found that cost efficiency, in general for all bank types, hovered around 0.44 efficiency throughout the study, and allocative inefficiencies rose during the 20022007 period. Therefore, their overall results did not show improvement in efficiency in the Brazilian banking sector. Also, they found that non-performing loans are a key indicator of banks' efficiency levels. Not only did they run DEA analysis, they also analyzed the setup of the Brazilian banking sector in order to determine why the numbers may be so different than their foreign counterparts. One thing they noted was that as the corporate bond market is not developed in Brazil and firms are forced to use banks more for their financing, consequently, banks play a more important role in the economic development of private sector financing than in other countries.
An additional study on Brazil focused on the profitability and spreads of public banks versus private banks. Barros (2008) found some important notes for possible efficiency/inefficiency rankings of banks. The author noted that the public banks in Brazil are run as private institutions even though they are government owned. This is due in part to the fact that public banks are also listed on the stock market and, thus, are under pressure to remain profitable and competitive. The article also points out that the Brazilian government uses the public banks to implement their social policies. The funds made available to the public banks in order to cover these programs sometimes do not equal their actual costs and the public banks must pass on these incurred costs to their clients. This then leads to a lower efficiency rating even though it is not necessarily the management's failure to control costs that added these extraneous costs to their bottom lines. The author found government policies that add costs to public banks actually increase the profitability of the private banks in the sector, because these increased prices to public bank customers allowed for private banks to raise their prices, increasing their spreads and profitability as they did not have the increased cost burden.
Another DEA study on the Brazilian banking sector was undertaken by Pires Goncalvez (2008) over the 1995-2006 period. The study used DEA efficiency scores as a proxy for management quality within the Camel (Capital adequacy, asset quality, management quality, earnings ability and liquidity position) bank rating system. The results showed that there were differences between efficiency scores that could help indicate at risk banks with quality control issues. The study analyzed the top 50 banks in Brazil and found that over the period, public banks were more efficient than their private bank counterparts. Also noted was the overall increase in efficiency scores from 0.74 in 1995 to 0.87 in 2005.
Casu, Girardone and Molyneux (2004) studied multiple European banks from 1994 to 2003. In their study, they used DEA to model banking efficiency over the period. They were able to point out cost efficiency gains in numerous countries' banking industries over the period studied until 2000. The increased inefficiency or wastage after 2001 could be attributed to increased competition and the influence of further deregulation and preparation for the introduction of the euro.
Kirkwood and Nahm (2006) viewed banks as intermediaries and used two separate DEA models based on cost efficiencies in order to analyze the Australian banking market for the 1995-2002 period. The two models were used in order to test for banking service efficiency and profit efficiency. Their study showed that the large/major banks had increased their banking service, profit and revenue efficiencies over the period while medium sized banks maintained the same levels of banking service efficiency and suffered a decline in profit efficiency and revenue efficiency. They also noted that these increased efficiencies were rewarded with higher stock valuations.
A Greek study from 1993-2005 by delis, Koutsomanoli-Filippaki, Staikouras and Gerogiannaki (2009) was used in order to compare SFA cost and profit efficiencies to DEA. The period was Marked by financial reforms, economic crises and joining the euro. With their SFA analysis they found that Greek banks were significantly better in terms of cost efficiency versus profit efficiency. Additionally, large banks were found to be slightly more cost efficient than their smaller counterparts. While in terms of profit efficiency, the medium and small banks had greater profit efficiency then their larger counterparts, which may be explained by smaller banks taking greater risks in their loan portfolios. Furthermore, their SFA analysis found that private banks had superior profit and efficiencies and had improved their cost efficiencies over the period to approximately the superior cost efficiency level of the public banks. Using the same variable set, their DEA analysis gave significantly lower efficiency scores than SFA. They also found that efficiency improved over the entire period using DEA, while efficiency increased with SFA until 2002 when it began to decrease. They further note that the DEA and SFA do give weakly consistent rankings over the period for cost efficiency. However, both did reach the same conclusion in that bank size has a positive relationship with cost efficiency, yet they conflicted on the relationship between ownership (private versus public) and cost efficiency.
Bos and Kolari (2005) set out to analyze the economic motivations for geographic expansion by Us and European banks. Their study uses both stochastic frontier approaches for cost and profit in order to test for economies of scale and scope for the 1995-1999 period. They found that in general, the large Us and European banks have increasing profit returns to scale and similar increasing profit returns to scope. Therefore, they are driven to increase their size in order to take advantage of their returns to scale and scope. Also, they find that large Us banks are more profit efficient than their large European counterparts. And, in general, they found that small banks (regardless of region) have higher cost efficiencies while lower profit efficiencies in comparison to the larger banks.
Also in a similar study, Schure, Wagenvoort and O'Brien (2004) used DEA to solely analyze the European banking sector from 1993 to 1997. Their study found that larger commercial banks were more productive and efficient than their smaller European counterparts over the entire time period.
In their study of 15 organization of economic Co-operation and development (OECD) countries, Lozano-Vivas and Pastor (2006) focused on macro-economic efficiency as well as financial efficiency developments from 1980-1997. Using DEA analysis, they developed both a worldwide macro-economic efficiency and a financial efficiency frontier. They did this by determining inter- and intra-country efficiency and testing for productivity changes, before analyzing any relationship or associations between the three. The countries showed a convergence of macro-economic and financial efficiencies over the time period with nearly all countries showing an increase in efficiencies.
When focusing on another BRIC (Brazil, Russia, India, and China) economy, specifically India, Shanmugam and das (2004) divided banks into separate groups based on ownership and size. They noted that the Indian regulatory agency was trying to foster economic growth, which influenced their choices of variables for their analysis. Their SFA study focused on the banking reform period of 1992-1999. They found that all forms of banks did improve their technical efficiency especially in the investments variable, which follows the regulatory agency's desire to increase economic growth.
They report that state-owned and foreign banks were more efficient than their private Indian bank counterparts over the period. Moreover, on average, Indian banks were only achieving a 45% technical efficiency rating, leaving them much to work towards in the future.
A later analysis of the Indian banking sector performed by Debnath and Shankar (2008) focused on 2004-2005. Their findings were interesting as they were among the few authors to show a negative relationship between bank size and efficiency. Their DEA analysis of the period showed that medium sized banks were the least efficient in comparison to large or small banks. They also found that no banks were facing increasing returns to scale regardless of size or ownership and that any mergers, in order to eliminate inefficient banks, would be counterproductive if they were looking to gain efficiencies.
Data and Methodology
The data set is taken from statistics on the top 50 universal banks in Brazil from the Banco Central do Brasil (Brazilian Central Bank). We analyzed 37 quarterly reports from the first quarter of 2002 to the first quarter of 2011 representing the lead up to the financial crisis and after the financial crisis for these top 50 banks. This allowed for 1850 possible total bank quarter observations. The authors feel that the top 50 banks represent a significant part of the market, as they never dip below 82% of the total assets in the market.
The bank data is divided in terms of bank size based on total assets and ownership type set forth by the Central Bank of Brazil. Public banks are defined as banks that are owned by the federal or state governments, Private domestic Banks, and Foreign Banks3 in order to better gauge whether or not these factors have any influence over efficiency scores.
We used the DEA measure of efficiency to test for efficiency in the Brazilian banking sector. In terms of inputs versus outputs oriented DEA, we decided to use an input oriented DEA model focusing on cost efficiency. This is designed to better show managerial effectiveness for controlling costs that come about with more intense concentration on the market. It allows us to test for possible market power as the efficiency scores will help us determine whether bank managers are running a more efficient bank. Additionally, in input oriented models, technical inefficiency is shown as a proportional reduction in input utilization. This allows us to use the DEA score as a proxy for effects of competition on managerial efficiency. We also note that we see banks as intermediaries and thus use the intermediation approach to analyze banks.
Within the body of literature, there is discussion on returns to scale and their effect on DEA analysis. The constant return to scale model functions only when all DMU are functioning at an optimal scale. This would not seem to hold true for a study of Brazilian banking as factors such as imperfect competition, financial constraints, government social programs pressed upon public banks would all affect a bank's ability to operate at an optimal scale. The variable return to scale approach has been more widely used throughout the literature and would seem to fit better within our analysis.
Detailing the outline of the methodology of DEA.
Θ* = min Θ
Subject to:
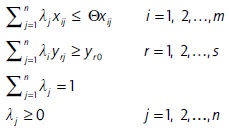
Where:
Bank0 represents one of the n banks being analyzed.
λ represents the weight given to each bank that forms the efficiency frontier.
Θ* is the input oriented efficiency measure for Bank0.
xi are the i-th inputs for Bank0.
yr are the r-th outputs for Bank0.
If we have Θ* = 1, Bank0 would be considered to be on the efficient frontier and be a best-practices bank in terms of cost efficiency. When we measure the bank and it receives an efficiency score of Θ* = 1, this means that Bank0 is on the efficiency frontier. If the Θ* of a bank's DMU is less than 1, then it is considered inefficient in terms of the bestpractice efficient banks. Therefore if Θ* = 0.75 we would say that Bank0 is inefficient with 75% cost efficiency in terms of the best-practice banks that form the frontier. In other words, they are 25% less efficient than the fully efficient banks.
In terms of the inputs and outputs used for our study, we have inputs of: interest expenses to show the cost of interest baring products, operating expenses net Personnel expenses to show the cost of running the bank minus the personnel costs, and Personnel expenses to show the amount spent on the labor force in order to produce bank outputs. These characterize the inputs needed in order for banks to perform their actions as intermediaries between depositors and borrowers. The outputs used are investments, total loans & leases net of provision for loan losses to show the output of loans and leases that banks have produced, and total deposits as this is also considered an output as the desirability or demand for a bank's services can be derived from its total deposits.
Then, for explanatory purposes, we use total assets for scaling the banks in order to allow us to determine whether bank size demonstrates differences in efficiency in the market. We additionally analyze the results by controlling for ownership type noted by Foreign owned banks, Public Banks that are controlled by the federal or individual state governments, and domestic Private Brazilian banks.
We used the deamax software developed by Cheng Gang of Peking University and Qian Zhenhua of the University of science and technology of Beijing, China (Cheng & Qian, 2011), to conduct data envelopment analysis. Consequently, in this analysis we used a one-stage dea model with vRs in order to analyze input-oriented cost efficiencies in the Brazilian banking industry.
Empirical results
Overall efficiency scores
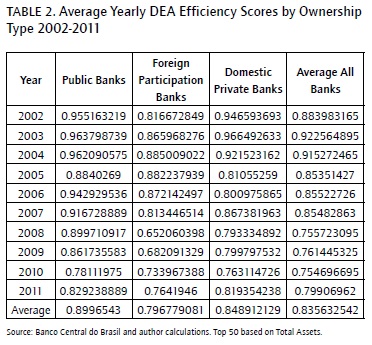
The quarterly results derived from the data envelopment analysis show that over the 2002-2011 period, the overall average relative efficiency of banks in Brazil had a slightly negative path. Table 2 and Chart 1 both show the overall yearly average dea efficiency scores for the industry (note that in Charts 1, 2, 3 and 4 and tables 2, 3, 4 and 5 that the yearly 2011 dea scores are represented by the first quarter scores). We have divided our analysis into two parts. One is based on ownership type and the other on the size of the banks where we have divided the banks into groups of the top 5, top 10, Banks 6-10, Banks 10-50, Banks 11-25, Banks 26-50 and an all bank average. The scores are divided between bank average and weighted average dea efficiency scores average, where total assets are used as the weight.
It is important to note that dea efficiency scores are relative measures of efficiency; here, they only compare efficiency for the quarter that is under analysis. Therefore, it is best to say that the efficiencies scores are in relation to the most efficient banks in that period. However, it can be used to compare overall relative efficiency in the market over time to gauge whether certain groups are becoming less or more efficient relative to their peers, which follows with the notes from Pires Goncalves (2008) study over the 1995-2006 period and Staub et al.'s (2010) study over the 2000-2007 period.
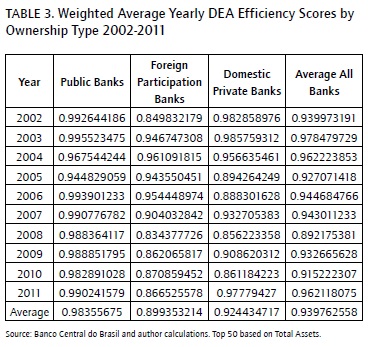
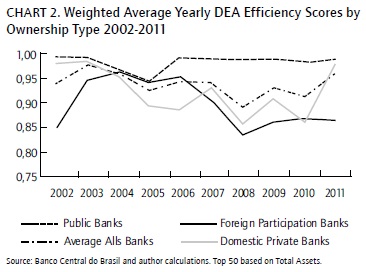
Earlier studies by Staub et al. (2010) and Pires Goncalves (2008) found an increase in efficiency scores from 19952006, and our study does find an increase in efficiency at the beginning of our study 2002-2005, but post 2005 there is a decrease in efficiency in the sector. The empirical results show that the average bank's Efficiency Score for 2002 was 88%, then an increase to 91.5% in 2004, followed by a decrease to 85% by 2006 with a further decrease to 76% for 2009 and an upturn to 80% for the first quarter 2011, and an overall DEA efficiency score of 84% for the 2002-2011 period. This downward trend is lessened when we take bank size into the equation. By using weighted averages, we end up with a 2002 score of 93.9%, 94.4% for 2006, 93.2% for 2009, and 96.2% for Q1 2011 with an overall weighted average DEA efficiency score for the sector at 94%. This would give weight to the idea that the efficiency in the market was more stable than declining if we focus on the larger banks. However, we discuss Bank size and efficiency later in this chapter. Charts 1 and 2 and tables 2 and 3 give the yearly average and Weighted average DEA efficiency scores.
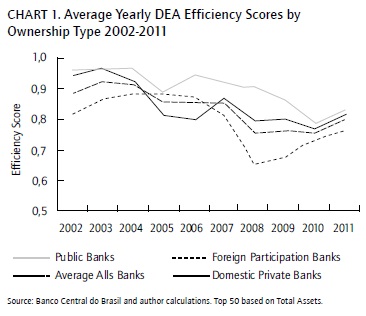
One can note the influence of the financial crisis of the late 2000s on the efficiency scores as the average efficiency scores drops 10% from 2007 to 2008 or the beginning of the crisis, while the efficiency scores maintain their 2008 levels for 2009 and start to recover in 2010.
Also noteworthy, as in Pires Goncalves (2008) study from 1995-2006, it was found that most quarters have approximately half of the banks with an efficiency score of 1 or fully efficient. This is consistent with the DEA efficiency scores that our study obtained. This nearly 50% ratio of fully efficient banks continued for each quarter of our study as well from 2002-2011. The fully efficient banks were found throughout the top 50 banks; however, they were found more often in the higher rankings of the top 50.
Efficiency scores by ownership type
Focusing on ownership type and DEA efficiency scores, there are numerous important results that we perceive. First, Public Banks consistently ranked more efficient than their Foreign owned (approximately 10%) and Private domestic (approximately 5%) counterparts over the life span of the study. In only one quarter in the 2002-2011 period, did Public Banks not have the highest efficiency score. This goes against the popular belief that Public institutions such as banks are inherently less efficient as well as the criticism leveled against Brazilian Public Banks in Brazil during the time of the study (Pires Goncalves, 2008).
However, the results show that, throughout the study, Public Banks ranked higher on average and in terms of a weighted average than all other banks. This is shown by the fact that over the period, Public Banks' weighted average DEA efficiency score is almost 1) this higher efficiency in Public Banks was also found in earlier studies for 1995-2006 by Staub et al. (2010) and Pires Goncalves (2008). Tables 2 and 3 and Charts 1 and 2 visualize the yearly DEA efficiency scores by ownership type.
We surmise that this phenomenon has something to do with managers in the Public banks being able to have financial support and backing from the federal or state budgets and, thus, not being as pressured by market pressures. Then the fact that the Public Banks act and function almost as private banking, since many of the Public Banks actually have shares available, they are run with a more focused efficient approach than a "typical" public enterprise. The combination of these two phenomena allow for managers to weather downturns better than their private counterparts as they do not need to incur inefficient costs in order to survive in turbulent economic times, such as the current financial crisis.
A further note on ownership and efficiency is how Foreign Banks consistently rank as the least efficient banks on average over the period. The average Foreign Bank scored a 79.7% in the 2002-2011 period which is 10% less than public banks and 5% less than Private domestic Brazilian banks.
The low efficiency average is greatly affected by the severe drop in Foreign Bank efficiency scores during the last half of the study. However, previous studies did note that foreign banks were the least efficient banks in the Brazilian banking sector (Pires Goncalves 2008 & Staub et al., 2010). The large drop corresponds to the worldwide financial crisis which saw many foreign banks decrease their participation outside of their core home markets, for example Foreign Bank participation in Brazil fell in terms of total assets, total deposits and total loans over the life span of the study.
From 2007 to 2008, Foreign Bank efficiency dropped over 15% which corresponded to the decline in overall market share and participation in the whole sector as discussed earlier. While taking into account the Pre-Financial crisis period, the Foreign Banks were actually, on average, more efficient than their Private domestic competition. The 20042007 average scores of 88% efficiency for foreign banks and 84% efficiency for Private domestic banks which then switched positions for the 2008-2011 period with Foreign banks having a 70% efficiency score while domestic Private banks, dropped to a 79% efficiency score.
There are many factors that may influence these overall numbers. To begin with, foreign banks may be using inefficient paying schemes with their workers. This may come about from the need for higher ex-patriot pay packages to lure executives away from their home country. Additionally, factors in the home markets of foreign banks may have led them to re-evaluate their positions abroad and focus their attention on their home markets and, thus, relax their managerial controls in foreign markets. As the foreign banks are also private, they do not have the backing of the federal government and, therefore, cannot weather the financial storms as well as their Public Bank counterparts. This may lead to the selection of less than optimal input pricing due to volatility in the market.
Furthermore, as we can see by the weighted averages, the larger foreign banks were more efficient than their smaller counterparts; this may have something to do with their market selection. They may be targeting particular customer segments that, although possibly inefficient, do bring a better return. Thus, they may be selecting less than optimal efficient inputs, but their financial return seems to be quite positive regardless of the inefficiency.
The changes in the weighted average scores would lead us also to surmise that it is not only the Foreign banks that have separate management goals. The gaps between average and weighted average efficiency scores shows us that it is not only the type of bank that may determine their input and managerial selections, but their size as well.
Switching our focus to the size of banks and their efficiency scores shows us other interesting points especially when considering the "Quiet life" scenario discussed earlier. The results show that over the period of the study, the larger banks were better at maintaining their efficiency scores than their smaller counterparts.
Efficiency scores by bank size
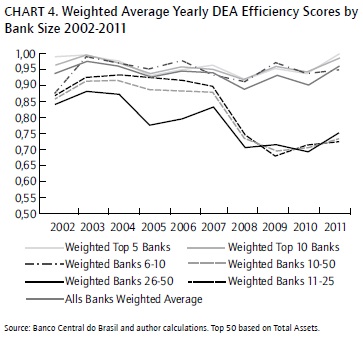
Similar to the common conception that public banks would be less efficient due to their nature and oversight, larger banks would seem to be less efficient as they would typically have more levels of bureaucracy, overhead costs and less direct oversight as managers would have larger groups of employees to watch. Nevertheless, just as in the Public Banks, the larger banks in Brazil are consistently the most efficient. Looking at Charts 3 and 4 and tables 4 and 5, we can see that the top 10 banks in Brazil over the period have lengthened the gap between themselves and Banks 11-50. In 2002, the difference between the top 10 Banks in Brazil and the rest of the top 50 was approximately 0.073, and the bottom 40 banks were 7% less efficient than the top 10 banks. By 2006, it had reached 13% and by 2010 the gap had expanded even further to where the smaller banks were nearly a quarter less efficient than their larger competitors.


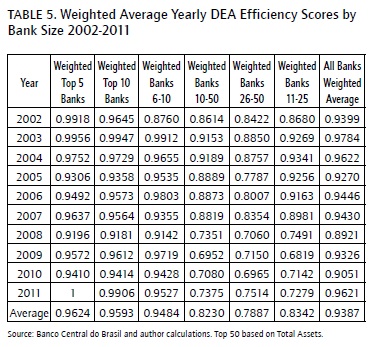
Furthermore, if we look at the smallest banks, Banks 2650, we can see that they have the lowest efficiency scores of all indeterminate of average or weighted average. There were only two years, 2009 and 2011,4 where they ranked higher than their other smaller bank competitors in Banks 11-25. This consistently lower efficiency score coincides with smaller banks inabilities to achieve scale economies due to their limited size.
If we focus solely on the top 10 Banks, we can see that they have maintained their overall average efficiency remarkably well. They have maintained mid to high 90% efficiency ratings without fail throughout the study. This would lead us to surmise that the managers of the larger banks have been better able to weather the economic cli-mate of Brazil and leverage their size to help maintain competitive and efficient cost management policies. These efficiencies, in theory, could then be passed onto their clients which would then make their services more attractive and thus bring in more clients.
The dominance of the larger banks in terms of DEA efficiency scores is best represented when comparing the average efficiency scores (Chart 3 and table 4) versus the weighted average efficiency scores (Chart 4 and table 5) for all banks. We can see that when taking into account total assets as a proxy for bank size we find that the overall efficiency score is Markedly higher, for example 2002 88.3% to 94%, 2004 91.5% to 96.2%, 2006 85.5% to 94.4%, 2008 75.5% to 89.2%, 2010 75.5% to 90.5%, this further stresses the dominating efficiency of the very large banks.
If we look at the after effects on efficiency of the recent financial crisis, we see that overall, in 2008, the efficiency scores across the board suffered. The Top 5 banks' efficiency scores dropped on average 4.5% in 2008. The drop was further pronounced when looking at the smaller banks: 15% for Banks 11-25 and 13% for Banks 26-50 and their subsequent difficulties in returning to pre-2008 relative efficiency. Since the main drop in 2008 overall efficiency has stagnated for the smaller banks in 2009 and 2010, though through Q1 2011, the efficiency scores have improved slightly. This leads us to believe that the smaller banks were unable to deal with the after effects of the crisis and that their managerial limitations due to their small size has made it more difficult for them to keep up with their larger counterparts in terms of efficiency. While, on the other hand, the larger banks were in a better position to weather the financial crisis as we see that by 2009, the relative efficiency of the top 5 banks was back to its pre-crisis levels. So in terms of relative efficiency, bigger is better.
The counter intuitive thinking that large banks are actually more efficient than their smaller more "nimble" counterparts holds true in Brazil. Focusing on the combination of continuous concentration in the market as well as the larger banks consistently achieving higher efficiency scores, the growing gap between the large and small banks, and the feeling that bigger is better in terms of efficiency, we feel that the Brazilian banking sector is certainly not taking the "Quiet life" approach. The top 10 Banks are consistently efficient and growing their businesses thus doing the exact opposite of what the "Quiet life" theory would suggest they would.
The effects of the Financial crisis on banking efficiency
As mentioned above, the current crisis facing the world financial system has had an effect on the levels of efficiency in the Brazilian banking sector. Tables 6 and 7 show the average DEA efficiency scores for our subgroups by ownership type and Bank size. The drop in efficiency began at the beginning of 2008. The overall average bank efficiency score fell from 0.88 to 0.76.


The Financial crisis and banking efficiency by ownership type
We can see that the financial crisis has had an effect on all banking ownership types. In table 6, we can see that the all bank average DEA efficiency scores from the Pre-Financial Crisis to Post-Financial Crisis period dropped approximately 12%. This shows that overall sector efficiency did suffer.
Also of interest is that all ownership types saw a large downturn in their average efficiency scores. Public Banks were the most efficient in both periods with a Pre-Financial Crisis average efficiency score of 0.937 while in the Post-Financial Crisis period, the average had dropped to 0.842. The 9.5% drop in average relative efficiency for Public Banks was similar to the 9.3% drop in efficiency by their domestic Private Bank competitors.
The most effected ownership group was the Foreign Banks group. Their overall relative efficiency fell 16% from Pre-Crisis levels. As touched on previously, the greater fall in Foreign Bank efficiency may also have something to do with conditions outside the Brazilian market such as economic factors in the Foreign Banks' home markets that may have needed their attention and, thus, efficiency in their Brazilian branches suffered perhaps a more risk adverse portfolio position. This may be inferred by the de-crease in participation of Foreign Banks in the sector during the Crisis period, a drop in market share of 9% in total assets, 8% in total deposits and 8% in total loans from the second quarter of 2008 to the first quarter of 2011. However, this is just a conjecture as the additional research into foreign banks' home markets influence on their foreign branches efficiency is beyond the scope of this thesis.
The Financial crisis and banking efficiency by bank size
While bank ownership did show distinct and severe drops in efficiency scores across the board, the effects of the financial crisis on bank efficiency was not as universal when bank size was factored into the equation.
Looking at the results in terms of bank size, we can see that the top 10 Banks maintained an extremely high overall average efficiency score in both periods .961 and .935 respectively. And if we look at the biggest banks, the top 5 Banks, we see that they suffered the smallest drop off in efficiency scores of all the groups. While the industry saw an 8% drop in efficiency the Top 5 Banks' average efficiency scores fell a mere 2.2%, while Banks 6-10's average efficiency scores fell only 2.7% when comparing Pre-Financial and Post-Financial Crisis levels.
The smallest banks, Banks 26-50 had a much more difficult time adjusting to the new efficiency pressures put upon them by the financial crisis as their average efficiency score fell 12.5%. The largest efficiency losers with the advent of the financial crisis were the middle sized banks, those ranked between 11-25 in terms of total assets. They lost approximately 17.7% of their relative efficiency. Also, the smallest banks (banks ranking 26-50) lost slightly less efficiency than the Banks 11-25 group. This may be due to their small niche markets that they were better able to adapt to the changes that were brought about during the crisis.
Though both groups did fall to approximately 76% efficiency when compared to the best banks in the market. The precipitous fall in relative efficiency may be a combination of their lack of resources due to their small sizes to adjust to the new competitive environment that the crisis left them and that the larger banks did a better job at maintaining their efficiencies through the crisis. This would then lead to a lower relative efficiency Mark for the smaller banks as they were unable to match the cost and efficiency savings that the larger banks were able to do.
The juxtaposition of all bank ownership types losing on average a minimum of 10% efficiency due to the financial crisis while the top 5 and top 10 banks efficiency scores moved even further, strengthens my belief that not only is bigger better in terms of efficiency in the sector, but that the large Brazilian banks are not sitting back and letting the financial crisis hurt their efficiency levels. They are, therefore, not falling into the "Quiet life" approach. These results lead us to surmise that larger banks are better suited to adjust to the changes in pressures put upon them from the financial crisis.
Conclusions
The empirical results showed that the Brazilian banking sector is highly relatively efficient with an overall efficiency score average of 0.835 for the 2002-2011 period. Although, over the 2002-2011 period relative efficiency as a whole fell from 0.884 average efficiency score in 2002 to 0.755 in 2010. On the other hand it would seem that efficiency is on the upswing as overall average quarterly data was improving through Q4 2010 and Q1 2011. Previous studies have stated that efficiency in the Brazilian banking sector has stagnated over time (Staub et al., 2010) while others have stated that there was an improvement in efficiency (Pires Goncalves, 2007). Additionally, we found that efficiency scores varied by ownership type. Overall Public Brazilian banks were the most efficient banks over the life span of the study with an average score of 0.899.
Foreign banks, on the other hand, come in behind domestic Private Brazilian banks in terms of efficiency. Looking at the quarterly efficiency scores, we can see that foreign banks were hit the hardest by the financial crisis and their need to deal with home market issues may have trumped any of their efficiency hopes in non-home markets, as well as cause them to exit the market. Therefore, we can say that ownership does have a relationship with the level of efficiency and managerial decisions regarding efficiency.
The current financial crisis has had a negative impact on the relative efficiency of Brazilian banks. The Pre-Crisis average dea efficiency score was 0.881 while the Post-Crisis average was 0.761. Again, looking at ownership type the results show that Foreign Bank efficiency was hurt the most, falling from 0.856 to 0.699 in the Post-Financial Crisis period. The domestic Private Banks fared little better, falling from 0.886 to 0.788 efficiency. Even the most efficient Public Banks took a hit, falling from 0.937 to 0.842. Consequently, we do find that the crisis definitely affected efficiency in the Brazilian banking sector in a negative way.
When looking at Bank size and the effects of the Financial Crisis the larger banks hold their relative efficiency remarkably well through the rough financial times regardless of Ownership Type. The Top 10 Banks' average DEA efficiency score only fell 0.025 from their Pre-Financial Crisis efficiency levels, from 0.961 to 0.936. The smallest banks, Banks 26-50 saw their relative efficiency fall from 0.842 to 0.717, while the middle banks, Banks 11-25 saw the largest drop, falling from 0.892 efficiency to 0.716.
On the whole, in Brazil the term "bigger is better" does hold weight in terms of efficiency. The top 5 Banks were the most efficient banks over the life span of the study. This effect even held through the financial crisis as the top 10 Banks were only slightly negatively affected by the crisis losing only about 2.7% of their relative efficiency during the crisis, we could say that bigger is indeed better.
Finally, with the Brazilian banking sector continually concentrating there is a threat that the banks could take over the markets and become inefficient and pass on their inefficiencies to their final customers in the form of higher prices. However, given that the largest banks (top 3, top 5 and top 10) have been gaining market share from their smaller competitors while maintaining the highest efficiency scores and efficiency correlating positively with size and revenues, we feel it is safe to say that large Brazilian banks are not taking the "Quiet life" approach in their managerial endeavors.
Taking into account the usual market fluctuations and recent global financial crisis, we find that ‘Bigger is better' in terms of efficiency and the Brazilian Banking sector has not taken the "Quiet life" approach. This follows Demsetz' Efficiency Hypothesis that more efficient businesses will win business from their less efficient competitors. And with the combination of increased gaps in efficiency between larger and small banks and the continued concentration in the top 10 banks in the market, we can safely conclude that the more efficient banks are winning in the market place.
Notes
1Average annual inflation rate for Brazil in the 1980s was 336%
(Fraga, 2004).
2Market share of total assets, total deposits, and total loans is
based on banks represented in the top 50 banks only, and does not include
foreign banks that are not in the top 50.
3Foreign controlled banks as well banks with foreign participation.
4Year 2011 is represented by Q1 2011 only.
References
Banker, R.D., Charnes, A., & Cooper, W.W. (1984). Some models for estimating and scale inefficiencies in data envelopment analysis. Management Science, 30, 1078-1092.
Barros, A. (2008). How to make Bankers Richer: the Brazilian financial market with public and private banks. The Quarterly Review of Economics and Finance, 48, 217-236.
Beck, T., Crivelli, J.M., & Summerhill, W. (2005). State bank transformation in Brazil - choices and consequences. Journal of Banking and Finance, 29, 2223-2257.
Belaisch, A., (2003). Do Brazilian banks compete? IMF Working Paper No 03/113. IMF.
Berger, A.N., & Hannan, T.H. (1998). The efficiency cost of market power in the banking industry: a test of the "quiet life" and related hypotheses. The Review of Economics and Statistics, 80(3), 454-465.
Berger, A.N., & Humphrey, D.B. (1997). Efficiency of financial institutions: international survey and directions for future research. European Journal of Operational Research, 98, 175-212.
Berger, A., & Mester, L. (1997). Inside the black box: What explains differences in the efficiencies of financial institutions? Journal of Banking and Finance, 21, no.7, 895-947.
Bos, J., & Kolari, J. (2005). Large bank efficiency in europe and the United states: are there economic motivations for geographic expansion in financial services? The Journal of Business, 78, 1555-1592.
Camanha, A., & Dyson, R. (2006). Data envelopment analysis and malmquist indices for measuring group performance. Journal of Production Analysis, 26, 35-49.
Casu, B., & Girardone, C., Molyneux P. (2004). Productivity change in european banking: a comparison of parametric and non-parametric approaches, Journal of Banking and Finance, 28(10), 2521-2540.
Casu, B., & Girardone, C. (2009). Testing the relationship between competition and efficiency in banking: a panel data analysis. Economics Letters, 105, 134-137.
Chang, C.E., Hasan, I., & Hunter, W.C. (1993). Efficiency of multinational banks: an empirical investigation. Applied Financial economics, vol. 8 (6), 689-696.
Charnes, A., Cooper, W.W. & Rhodes, E. (1978). Measuring the efficiency of decision making units. European Journal of Operations Research, 2, 429-444.
Cheng, G., & Qian, Z. (2011). DEAMax Manual Version 5.0. March.
Claessens, S., Demirguc-Kunt, A., & Huizinga, H. (2001). How does foreign entry affect domestic banking markets? Journal of Banking and Finance, 25, 891-911.
Coelli, T. (1996). A guide to DEAP version 2.1: a data envelopment analysis (computer) program. Working Papers 8/96. Centre for efficiency and Productivity analysis (CEPA).
De Paula, L., & Alves Jr., A.J. (2003). Banking behaviour and the Brazilian economy after the real plan: a post-Keynesian approach. Banca Nazionale del Lavoro Quarterly Review, vol 56 (227), 337-365.
Debnath, R., & Shankar, R. (2008). Measuring performance of indian banks: an application data envelopment analysis. International Journal Performance Management, 10(1), 57-85.
Delis, M., Koutsomanoli-Filippaki, A., Staikouras, C., & Gerogiannaki, K. (2009). Evaluating cost and profit efficiency: a comparison of parametric and nonparametric methodologies. Applied Financial Economics, 19, 191-202.
Demsetz, H. (1973). Industry structure, market rivalry, and public policy, Journal of Law and Economics, 16(1), 1-9.
Deyoung, R., & Nolle, D. (1996). Foreign-owned banks in the Us: earning market share or buying it? Journal of Money, Credit, and Banking, 28, 622-636.
Halkos, G., & Salamouris, D. (2001). Efficiency measures of the Greek banking sector: a nonparametric approach for the period 1997-1999. RePEc Paper 2858. Munich Personal.
Halkos, G., & Salamouris, D. (2004). Efficiency measurement of Greek commercial banks with the use of financial ratios: a data envelopment analysis approach. Management Accounting Research, 15, 201-224.
Hicks, J. (1935). Annual survey of economic theory: the theory of monopoly. Econometrica.
Kirkwood, J., & Nahm, D. (2006). Australian banking efficiency and its relation to stock returns. The Economic Record, 82(258), 253-267.
Lozano-Vivas, A., & Pastor, J. (2006). Relating macro-economic efficiency to financial efficiency: a comparison of fifteen OECD countries over an eighteen year period. Journal of Production Analysis, 25, 67-78.
Lucinda, C. (2010). Competition in the Brazilian loan market: an empirical analysis. Estudos Economicos, 40(4), 831-858.
Mahajan, A, Rangan, N., & Zardkoohi, A., (1996). Cost structures in multinational and domestic banking. Journal of Banking and Finance, 20, 238-306.
Maudos, J., & de Guevara, J. F. (2007). The cost of market power in banking: social welfare loss vs. cost inefficiency. Journal of Banking and Finance, 31, 2103-2125.
Nakane, M.I., & Weintraub, D.B. (2005). Bank privatization and productivity: evidence for Brazil. Journal of Banking and Finance, 29, 2259-2289.
Neto, P., Araujo, L., & Ponce, D., (2005). Competição e concentração entre os bancos Brasileiros. VIII Encontro Nacional de Economia da Regiao Sul 2005, Porto Alegre. Anais VIII Encontro Regional de Economia da Regiao Sul 2005.
Pires Goncalves, R., (2008). Management quality measurement: Using date envelopment analysis (DEA) estimation approach for banks in Brazil. RePEc Paper 11143. Munich Personal Archive.
Schure P., Wagenvoort R., & O'Brien D. (2004). The efficiency and the conduct of european banks: developments after 1992. Review of Financial Economics, 13(4), 371-96.
Shanmugam, K., & Das, A. (2004). Efficiency of indian commercial banks during the reform period. Applied Financial Economics, 14, 681-686.
Staub, R., Da Silva e Souza, G., & Tabak, B. (2010). Evolution of bank efficiency in Brazil: a dea approach. European Journal of Operational Research, 202, 204-213.
Teixeira, J., & Mollo M. (2006). Macrodynamic capacity and financial development: theoretical conception and observations on the Brazilian economy. Working Paper 325. University of Brasilia Department of Economics.
Yildirim, H. S., & Philippatos, G. C. (2007). Restructuring, consolidation and competition in latin american banking markets. Journal of Banking and Finance, 31, 629-639.
Referencias
Banker, R.D., Charnes, A., & Cooper, W.W. (1984). Some models for estimating and scale inefficiencies in data envelopment analysis. Management Science, 30, 1078-1092.
Barros, A. (2008). How to make Bankers Richer: the Brazilian financial market with public and private banks. The Quarterly Review of Economics and Finance, 48, 217-236.
Beck, T., Crivelli, J.M., & Summerhill, W. (2005). State bank transformation in Brazil - choices and consequences. Journal of Banking and Finance, 29, 2223-2257.
Belaisch, A., (2003). Do Brazilian banks compete? IMF Working Paper No 03/113. IMF.
Berger, A.N., & Hannan, T.H. (1998). The efficiency cost of market power in the banking industry: a test of the "quiet life" and related hypotheses. The Review of Economics and Statistics, 80(3), 454-465.
Berger, A.N., & Humphrey, D.B. (1997). Efficiency of financial institutions: international survey and directions for future research. European Journal of Operational Research, 98, 175-212.
Berger, A., & Mester, L. (1997). Inside the black box: What explains differences in the efficiencies of financial institutions? Journal of Banking and Finance, 21, no.7, 895-947.
Bos, J., & Kolari, J. (2005). Large bank efficiency in europe and the United states: are there economic motivations for geographic expansion in financial services? The Journal of Business, 78, 1555-1592.
Camanha, A., & Dyson, R. (2006). Data envelopment analysis and malmquist indices for measuring group performance. Journal of Production Analysis, 26, 35-49.
Casu, B., & Girardone, C., Molyneux P. (2004). Productivity change in european banking: a comparison of parametric and non-parametric approaches, Journal of Banking and Finance, 28(10), 2521-2540.
Casu, B., & Girardone, C. (2009). Testing the relationship between competition and efficiency in banking: a panel data analysis. Economics Letters, 105, 134-137.
Chang, C.E., Hasan, I., & Hunter, W.C. (1993). Efficiency of multinational banks: an empirical investigation. Applied Financial economics, vol. 8 (6), 689-696.
Charnes, A., Cooper, W.W. & Rhodes, E. (1978). Measuring the efficiency of decision making units. European Journal of Operations Research, 2, 429-444.
Cheng, G., & Qian, Z. (2011). DEAMax Manual Version 5.0. March.
Claessens, S., Demirguc-Kunt, A., & Huizinga, H. (2001). How does foreign entry affect domestic banking markets? Journal of Banking and Finance, 25, 891-911.
Coelli, T. (1996). A guide to DEAP version 2.1: a data envelopment analysis (computer) program. Working Papers 8/96. Centre for efficiency and Productivity analysis (CEPA).
De Paula, L., & Alves Jr., A.J. (2003). Banking behaviour and the Brazilian economy after the real plan: a post-Keynesian approach. Banca Nazionale del Lavoro Quarterly Review, vol 56 (227), 337-365.
Debnath, R., & Shankar, R. (2008). Measuring performance of indian banks: an application data envelopment analysis. International Journal Performance Management, 10(1), 57-85.
Delis, M., Koutsomanoli-Filippaki, A., Staikouras, C., & Gerogiannaki, K. (2009). Evaluating cost and profit efficiency: a comparison of parametric and nonparametric methodologies. Applied Financial Economics, 19, 191-202.
Demsetz, H. (1973). Industry structure, market rivalry, and public policy, Journal of Law and Economics, 16(1), 1-9.
Deyoung, R., & Nolle, D. (1996). Foreign-owned banks in the Us: earning market share or buying it? Journal of Money, Credit, and Banking, 28, 622-636.
Halkos, G., & Salamouris, D. (2001). Efficiency measures of the Greek banking sector: a nonparametric approach for the period 1997-1999. RePEc Paper 2858. Munich Personal.
Halkos, G., & Salamouris, D. (2004). Efficiency measurement of Greek commercial banks with the use of financial ratios: a data envelopment analysis approach. Management Accounting Research, 15, 201-224.
Hicks, J. (1935). Annual survey of economic theory: the theory of monopoly. Econometrica.
Kirkwood, J., & Nahm, D. (2006). Australian banking efficiency and its relation to stock returns. The Economic Record, 82(258), 253-267.
Lozano-Vivas, A., & Pastor, J. (2006). Relating macro-economic efficiency to financial efficiency: a comparison of fifteen OECD countries over an eighteen year period. Journal of Production Analysis, 25, 67-78.
Lucinda, C. (2010). Competition in the Brazilian loan market: an empirical analysis. Estudos Economicos, 40(4), 831-858.
Mahajan, A, Rangan, N., & Zardkoohi, A., (1996). Cost structures in multinational and domestic banking. Journal of Banking and Finance, 20, 238-306.
Maudos, J., & de Guevara, J. F. (2007). The cost of market power in banking: social welfare loss vs. cost inefficiency. Journal of Banking and Finance, 31, 2103-2125.
Nakane, M.I., & Weintraub, D.B. (2005). Bank privatization and productivity: evidence for Brazil. Journal of Banking and Finance, 29, 2259-2289.
Neto, P., Araujo, L., & Ponce, D., (2005). Competição e concentração entre os bancos Brasileiros. VIII Encontro Nacional de Economia da Regiao Sul 2005, Porto Alegre. Anais VIII Encontro Regional de Economia da Regiao Sul 2005.
Pires Goncalves, R., (2008). Management quality measurement: Using date envelopment analysis (DEA) estimation approach for banks in Brazil. RePEc Paper 11143. Munich Personal Archive.
Schure P., Wagenvoort R., & O'Brien D. (2004). The efficiency and the conduct of european banks: developments after 1992. Review of Financial Economics, 13(4), 371-96.
Shanmugam, K., & Das, A. (2004). Efficiency of indian commercial banks during the reform period. Applied Financial Economics, 14, 681-686.
Staub, R., Da Silva e Souza, G., & Tabak, B. (2010). Evolution of bank efficiency in Brazil: a dea approach. European Journal of Operational Research, 202, 204-213.
Teixeira, J., & Mollo M. (2006). Macrodynamic capacity and financial development: theoretical conception and observations on the Brazilian economy. Working Paper 325. University of Brasilia Department of Economics.
Yildirim, H. S., & Philippatos, G. C. (2007). Restructuring, consolidation and competition in latin american banking markets. Journal of Banking and Finance, 31, 629-639.
Cómo citar
APA
ACM
ACS
ABNT
Chicago
Harvard
IEEE
MLA
Turabian
Vancouver
Descargar cita
CrossRef Cited-by
1. Matheus da Costa Gomes, Sonia Valle Walter Borges de Oliveira, Alberto Borges Matias. (2017). Eficiência do setor bancário brasileiro no período de 2006 a 2013: bancos domésticos x bancos estrangeiros. Nova Economia, 27(3), p.641. https://doi.org/10.1590/0103-6351/3057.
2. Francisco Javier Sáez-Fernández, Andrés J. Picazo-Tadeo, Ignacio Jiménez-Hernández. (2021). Performance and risk in the Brazilian banking industry. Heliyon, 7(3), p.e06524. https://doi.org/10.1016/j.heliyon.2021.e06524.
3. Hakan YALÇINKAYA. (2021). Türk Bankacılık Sisteminde Kamusal Sermayeli Bankaların Karşılaştırmalı Etkinlik Analizi: 2008-2017 Dönemi Değerlendirmesi. Celal Bayar Üniversitesi Sosyal Bilimler Dergisi, https://doi.org/10.18026/cbayarsos.744169.
4. Ihsan Isik, Ozge Uygur. (2021). Financial crises, bank efficiency and survival: Theory, literature and emerging market evidence. International Review of Economics & Finance, 76, p.952. https://doi.org/10.1016/j.iref.2021.07.016.
5. Dong Xiang, Parmendra Sharma, Yuming Zhang. (2019). The Global Financial Crisis, Fiscal Stimulus Package and the Chinese Banking Sector — A Pre- and Post-Efficiency Analysis. Review of Pacific Basin Financial Markets and Policies, 22(02), p.1950011. https://doi.org/10.1142/S0219091519500115.
6. Rachita Gulati, Sunil Kumar. (2016). Assessing the impact of the global financial crisis on the profit efficiency of Indian banks. Economic Modelling, 58, p.167. https://doi.org/10.1016/j.econmod.2016.05.029.
Dimensions
PlumX
Visitas a la página del resumen del artículo
Descargas
Licencia
Derechos de autor 2014 Innovar

Esta obra está bajo una licencia internacional Creative Commons Atribución-NoComercial-CompartirIgual 4.0.
Todos los artículos publicados por Innovar se encuentran disponibles globalmente con acceso abierto y licenciados bajo los términos de Creative Commons Atribución-No_Comercial-Sin_Derivadas 4.0 Internacional (CC BY-NC-ND 4.0).
Una vez seleccionados los artículos para un número, y antes de iniciar la etapa de cuidado y producción editorial, los autores deben firmar una cesión de derechos patrimoniales de su obra. Innovar se ciñe a las normas colombianas en materia de derechos de autor.
El material de esta revista puede ser reproducido o citado con carácter académico, citando la fuente.
Esta obra está bajo una Licencia Creative Commons:


