Published
Assessing the correlation between climate signals and monthly mean and extreme precipitation and discharge of Golestan Dam Watershed
DOI:
https://doi.org/10.15446/esrj.v19n1.40996Keywords:
Climate signals, Sea surface temperature, Sea level pressure, Precipitation, Discharge Correlation (en)Climate teleconnection signals are one of the main factors influencing the earth's climate oscillations in global and regional scales. In the present research, the effect of these signals on precipitation and discharge of Madarsoo Watershed at the upstream of Golestan Dam was investigated. For this purpose, three raingauges and hydrometric stations with respectively 40 and 38 years of daily rainfall and discharge data were selected. Pearson-correlation coefficient was used to consider the correlation between climate signals and monthly mean and extreme precipitation and discharge. The results showed strong correlation between monthly total precipitation of Tangrah and Tamer with Sea Level Pressure (SLP) of Caspian Sea with 7 and 9 months of lag, respectively, and Galikesh with Sea Surface Temperature (SST) of Caspian Sea with 9 months of lag. For monthly mean discharge of Tangrah and Galikesh, the maximum correlation was calculated for SLP of Caspian Sea with a lag of 9 months and Tamer with SST of Greenland with a lag of 7 months. For the extreme monthly data, very strong correlation was detected between the precipitations of all raingauges in June with Greenland SST with 8 months of lag. In contrast, for maximum monthly discharge of Tangrah and Galikesh hydrometric stations, the maximum correlation coefficients were calculated for SST of Black Sea with 4 months of lag in August and for Tamer with SLP of Caspian Sea with 4 months of lag in August. With regard to the results, the utilization of these signals, especially SLP and SST, is strongly suggested to predict the maximum and mean monthly precipitation and discharge over this region.
Resumen
Las señales de teleconexión atmosférica son uno de los factores principales que influencian las oscilaciones climáticas de la tierra a escala global y regional. En el presente estudio se investigan los efectos de estas señales en la precipitación y caudal de la cuenca hidrográfica Madarsoo, río arriba de la presa Golestan. Con este propósito se seleccionaron tres estaciones pluviométricas e hidrométricas con registros diarios de lluvia y caudal durante unas cuatro décadas. Se utilizó el coeficiente Pearson para considerar la correlación entre las señales climáticas y los índices medio y extremo mensual de precipitación y caudal. Los resultados muestran una fuerte correlación entre la precipitación total mensual de las estaciones Tangrah y Tamer con la Presión Barométrica a Nivel del Mar (SLP, inglés) en el mar Caspio, en un período de siete y nueve meses, respectivamente, y de la estación Galikesh con la Temperatura a Nivel del Mar (SST, inglés) en el Caspio durante nueve meses. Para la media mensual del caudal en Tangrah y Galikesh, la correlación máxima se calculó a través de la SLP del mar Caspio con un período de nueve meses, y la de Tamer con la SST del mar de Groenlandia en un lapso de siete meses. Para el índice extreme mensual se detectó una fuerte correlación entre las precipitaciones medidas en todos los pluviómetros en junio con la SST de Groenlandia en un período de ocho meses. En contraste, para el índice máximo mensual de caudal en las estaciones hidrométricas Tangrah y Galikesh se calcularon los coeficientes de correlación máxima para la SST del mar Negro en un lapso de cuatro meses en agosto y para la estación Tamer con la SLP del mar Caspio durante cuatro meses, también en Agosto. Con respecto a los resultados, se recomienda la utilización de estas señales, especialmente la SLP y la SST, para predecir los índices de precipitación y caudal medio y máximo en esta región.https://doi.org/10.15446/esrj.v19n1.40996.
METEOROLOGY
Assessing the correlation between climate signals and monthly mean and extreme precipitation and discharge of Golestan Dam Watershed
Hossein Ruigar1, Saeed Golian2
1 M.Sc. student, Civil Engineering Department, University of Shahrood, Shahrood, Iran. Email: hossein_ruigar@yahoo.com.
2 Assistant Professor, Civil Engineering Department, University of Shahrood, Shahrood, Iran. Email: s.golian@shahroodut.ac.ir.
Record
Manuscript received: 27/11/2013 Accepted for publication: 14/04/2015
ABSTRACT
Climate teleconnection signals are one of the main factors influencing the earth's climate oscillations in global and regional scales. In the present research, the effect of these signals on precipitation and discharge of Madarsoo Watershed at the upstream of Golestan Dam was investigated. For this purpose, three raingauges and hydrometric stations with respectively 40 and 38 years of daily rainfall and discharge data were selected. Pearson-correlation coefficient was used to consider the correlation between climate signals and monthly mean and extreme precipitation and discharge. The results showed strong correlation between monthly total precipitation of Tangrah and Tamer with Sea Level Pressure (SLP) of Caspian Sea with 7 and 9 months of lag, respectively, and Galikesh with Sea Surface Temperature (SST) of Caspian Sea with 9 months of lag. For monthly mean discharge of Tangrah and Galikesh, the maximum correlation was calculated for SLP of Caspian Sea with a lag of 9 months and Tamer with SST of Greenland with a lag of 7 months. For the extreme monthly data, very strong correlation was detected between the precipitations of all raingauges in June with Greenland SST with 8 months of lag. In contrast, for maximum monthly discharge of Tangrah and Galikesh hydrometric stations, the maximum correlation coefficients were calculated for SST of Black Sea with 4 months of lag in August and for Tamer with SLP of Caspian Sea with 4 months of lag in August. With regard to the results, the utilization of these signals, especially SLP and SST, is strongly suggested to predict the maximum and mean monthly precipitation and discharge over this region.
Key words: Climate signals, Sea surface temperature, Sea level pressure, Precipitation, Discharge- Correlation
RESUMEN
Las señales de teleconexión atmosférica son uno de los factores principales que influencian las oscilaciones climáticas de la tierra a escala global y regional. En el presente estudio se investigan los efectos de estas señales en la precipitación y caudal de la cuenca hidrográfica Madarsoo, río arriba de la presa Golestan. Con este propósito se seleccionaron tres estaciones pluviométricas e hidrométricas con registros diarios de lluvia y caudal durante unas cuatro décadas. Se utilizó el coeficiente Pearson para considerar la correlación entre las señales climáticas y los índices medio y extremo mensual de precipitación y caudal. Los resultados muestran una fuerte correlación entre la precipitación total mensual de las estaciones Tangrah y Tamer con la Presión Barométrica a Nivel del Mar (SLP, inglés) en el mar Caspio, en un período de siete y nueve meses, respectivamente, y de la estación Galikesh con la Temperatura a Nivel del Mar (SST, inglés) en el Caspio durante nueve meses. Para la media mensual del caudal en Tangrah y Galikesh, la correlación máxima se calculó a través de la SLP del mar Caspio con un período de nueve meses, y la de Tamer con la SST del mar de Groenlandia en un lapso de siete meses. Para el índice extremo mensual se detectó una fuerte correlación entre las precipitaciones medidas en todos los pluviómetros en junio con la SST de Groenlandia en un período de ocho meses. En contraste, para el índice máximo mensual de caudal en las estaciones hidrométricas Tangrah y Galikesh se calcularon los coeficientes de correlación máxima para la SST del mar Negro en un lapso de cuatro meses en agosto y para la estación Tamer con la SLP del mar Caspio durante cuatro meses, también en Agosto. Con respecto a los resultados, se recomienda la utilización de estas señales, especialmente la SLP y la SST, para predecir los índices de precipitación y caudal medio y máximo en esta región.
Palabras clave: Señales climáticas, Temperatura a nivel del mar, Presión barométrica a nivel del mar, Precipitación, Caudal, Correlación.
Introduction
In recent decades, the water demand has increased significantly in all domestic, agricultural and industrial sections, especially in arid and semi-arid areas where supplying water for different sectors is facing with serious problems. Prediction of rainfall and surface water runoff can help in managing water-related plans. In recent years, the interaction of climate factors on land, ocean and atmosphere has been investigated by many hydro-climatological scientists. Climate teleconnection signals in global and regional scales are one of the main factors influencing climate oscillations of earth. The most important widely-used signals are El-Nino Southern Oscillation (ENSO), North Atlantic Oscillation (NAO), Arctic Oscillation (AO), Pacific Decadal Oscillation (PDO) and Southern Oscillation Index (SOI). Periodic changes in sea level pressure (SLP) and sea surface temperature (SST) are other climate signals which have presented the opportunity to test the scientific community's skill in applying climate prediction models and estimating their effects on global climate variables, e.g. precipitation and temperature. Many studies have shown the significant effects of all aforementioned climate signals on precipitation and discharge of large basins, worldwide.
Angel (1981) compared SST variations in the equatorial eastern Pacific (0-10°S, 180-90°W) with variations in atmospheric temperature, circulation, rainfall and trace-constituent amount. A significant negative correlation was acquired between the values of SST in the East Pacific and Queensland of Australia rainy season. Nichols (1989) showed that the surface temperature can be part of the Indian Ocean and the Arabian Sea. Two patterns were correlated to sea surface temperatures in the Indian and Pacific oceans. The first rainfall pattern was best related to the difference in sea temperatures between the Indonesian region and the central Indian Ocean. The second rainfall pattern was related to equatorial Pacific sea surface temperatures. This relationship reflected the influence of the Southern Oscillation on both sea surface temperatures and Australian rainfall but the relationship between the first rainfall pattern and the difference between Indonesian and central Indian Ocean sea surface temperatures was largely independent of the Southern Oscillation. Kahaya and Dracup (1993) studied the relationship between the El Niño/Southern Oscillation (ENSO) and unimpaired streamflow over the contiguous United States. Coherent and significant streamflow responses to hypothesized ENSO forcing were found in four regions of the United States: the Gulf of Mexico, the Northeast, the North Central, and the Pacific Northwest. Once an ENSO event set in, a long-range forecasting utility may be available for these regions. Roucou et al. (1996) studied the atmospheric structure over north-east Brazil during anomalous rainfall years in the 11 levels of the outputs of the Laboratoire de Météorologie Dynamique Atmospheric General Circulation Model (LMD AGCM). The simulated March-April rainfall was in good agreement with observations. Correlation of simulated rainfall and three SST indices was relative to the equatorial Pacific and northern and southern parts of the Atlantic Ocean exhibited stronger relationships in the simulation than in the observations. Hughes and Saunders (2001) had considered monthly temperature and rainfall for a period of 95-year at the area of Europe and the Southern Oscillation index (SOI) and Nino3,4 index were used to evaluate the correlation with rainfall. In their study it was shown that the correlation between seasonal rainfall (during March, April and May) with seasonal Nino 3.4 (during December, January and February) was more than monthly and yearly correlation. Moron et al. (2001) have done three experiments started from different initial conditions with the ECHAM-4 atmospheric General Circulation Model (GCM) integrated at T30 resolution forced with the observed sea-surface temperature (SST) over the period 1960-1994. They showed that 35 to 55 percent of annual rainfall oscillations in tropical America in the Amazon area are explained with oscillations in tropical Pacific waters. Smolenski (2004) examined the mechanisms involved in the interactions among large-scale atmospheric circulation patterns and how they are related to surface air temperature anomalies in the North American Arctic. He believed that the negative phase of the Arctic Oscillation pattern, at low temperatures in North America and Europe, can cause different large-scale atmospheric circulation regimes. Gachrel (2004) found a good correlation (0.47, 5-month time delay) between the ENSO activity and the discharge of the main rivers in French Guiana. Shrestha and Kostaschuk (2005) used harmonic analysis to examine the impact of the El Nino/Southern Oscillation (ENSO) on mean-monthly streamflow variability in Nepal. El Nino caused below normal streamflows in two core regions: the Western Region and the Eastern Region. There was a stronger El Nino influence on streamflows compared to La Nina. Jochen and Wolfgang (2006) presented retrospective forecasts of the maximum water level in Central Amazonia by models based on the SOI and SST anomalies of the El Niño 3.4 region in February, four months before its appearance. The forecast of the flood-pulse allowed also predicting parameters correlated with the flood-pulse (e.g., tree growth, biogeochemical cycles) and increases the efficiency in planning and executing of economic activities by the human population (e.g., fishery, timber extraction, agriculture).Kim et al. (2007) analyzed the effects of large-scale climate signals such as NAO and SOI on the seasonal rainfall of Colorado River basin in US. Their results showed that modeling the dynamic systems of the climate can be useful in developing a long-term prediction model which will be valuable for the management of water resources. In another study, Revadekar and Kulkarni (2008) had considered the influence of ENSO on extreme winter rainfall in India. The relationship of El Nino-southern oscillation index with these extremes showed that this index can be used to predict frequency and intensity of extreme precipitation events, 4-6 months in advance. Some research have been conducted in various parts of Iran to investigate the relationship between large-scale climate signals with precipitation and discharge. Nazemosadat and Cordery (2000) showed that the ENSO phenomenon has a significant effect on winter and particularly autumn precipitation in Iran. Their investigations suggested that, due to the intense warm (or El-Niño) and cold (or La Niña) phases of ENSO, the intensity and predictability of dry and wet conditions in Iran are substantially altered. Their studies indicated that winter precipitation (January to March) in these regions is in inverse proportion to SST of the Persian Gulf. Ghayour and Khosravi (2001) studied ENSO signals and impacts on precipitation and other related elements during summer and autumn. The results suggested that precipitation significantly correlated with ENSO in autumn and its amount in ENSO warm phases (El Nino) was greater than cold and natural phases. Yarahmadi and Azizi (2007) studied on the relationship between rainfall in autumn, winter and spring with climate indices through regression analysis of the 25 synoptic stations of Iran. Their results indicated that from climate indices associated with ENSO, Niño 3.4, have the highest relationships with Iran autumn and winter rainfall. Motamedi et al. (2007) used annual and seasonal correlations between SOI and rainfall data and also between SOI and temperature data. They concluded that when SOI amounts are increased the temperature in Khorasan province will be decreased.
Fallah-Qhalhry et al. (2009) evaluated the role of climate change in signals on spring rainfall oscillations in the Khorasan province. Results showed a strong relation between Sea Level Pressure (SLP) and sea Level Pressure difference (ΔSLP) changes with the rainfall of the studied areas Zarehabyaneh and Bayat Varkeshi (2012) studied the number of rainy days and effect of ENSO phenomenon at the country level over Iran. The results of applying the Pearson correlation analysis, expressed the relationship between ENSO climatic indexes and the number of annual rainfall days.
The present research aims to assess the correlation between large scale climate signals, i.e. ENSO indices (including NINO1+2, NINO3.4, NINO3, NINO4, MEI), AO, NAO and PDO and also SST and SLP signals with monthly rainfall and discharge data (average and extreme values) of some raingauges and hydrometric stations over Madarsoo Watershed at upstream of Golestan Dam, Iran.
2- Case study:
The study area is Madarsoo Watershed at the upstream of Golestan Dam, North of Iran. Madarsoo Watershed is located between 53° 51' 32'' E to 56° 19' 21'' E longitude and 36° 30' 43'' N to 38° 08'13'' N latitude. It covers a 5155 km2 area and stretches between three provinces, Northern Khorasan, Semnan, and Golestan. The average annual temperature and precipitation are 17.8 °C and 450 mm, respectively.
Data for three raingauges, namely Tangrah, Tamer, and Galikesh, as well as three hydrometric stations with the same names were used to determine the correlation between climate signals and rainfall and discharge of this basin. Figure 1 shows the location of the watershed as well as the raingauge and hydrometric stations used in this study. Table (1) shows some statistical properties for total monthly precipitation and mean monthly discharge in the raingauges and hydrometric stations used in this study.

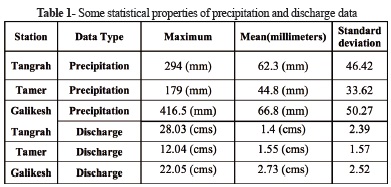
For this purpose, the average monthly rainfall and discharge of all the stations as well as the maximum monthly values were calculated for different months.
3- Methodology
3-1- Introducing climatic indices
El Niño/Southern Oscillation (ENSO) event is one of the most important and prominent events that leads to the emergence of major climate anomalies in many parts of the world (Alexander et al., 2005, Nazemosadat et al., 2003). Walker and Bliss (1932), for the first time, observed global scale fluctuations at sea level pressure and named it southern oscillation (SO). El-Nino is the ocean component of ENSO and is related to large changes in the sea surface temperatures in the tropical region of Pacific Ocean. El-Nino phenomenon is always associated with some changes in atmospheric pressure at sea level; that is why, meteorologists have never considered it as an isolated phenomenon; but, they are usually referring to El-Nino southern oscillation or ENSO. ENSO resembles a pendulum with oscillation between El-Nino conditions (hot water) and La-Nina events (cooling water). There are many indices related to ENSO, which include NINO1+2, NINO3, NINO3. 4, NINO4, MEI (multivariate ENSO index), and TNI (Trans Niño index). ENSO occurs when the difference between sea level pressure (SLP) is high at the equator and the sea surface temperature (SST) is low (Neelin et al. 1998).
MEI index (multivariate index ENSO) is one of the most important ENSO indices, which considers many parameters as follows:
MEI= f(P+V+U+S+A+C)
where U is zonal wind component surface, P is pressure at sea level, S is sea surface temperature, V is meridian wind component level, C is the cloud grade in the sky, and A is the surface temperature (Wolter, 1987).
North Atlantic oscillation (NAO) index is defined as the tendency of pressure to be low near Iceland in winter where pressure is high near the Azores and Southwest Europe. NAO is calculated based on the normalized sea level pressure difference (P) between the tropical Azores (A) and near-polar low pressure area in Iceland (I) as follows (Marshall et al., 2001):
NAO= P(A) - P(I)
Another teleconnection climate index is arctic oscillation (AO) pattern. This index as one of the north hemisphere teleconnection patterns which is defined as the anomalies of atmospheric sea level pressure in the north arctic and mid-latitude areas (45° north latitude). Iran is located in a region where various pressure systems, namely Mediterranean, Atlantic, and Siberian, are affecting the country. The formation of these pressure centers, under the governance of Arctic pressure patterns, can introduce a remote driver for atmospheric pressure centers in the northern Arctic latitudes and temperature oscillations in Iran (Regior et al., 2000).
Pacific decadal oscillation (PDO) is a climate phenomenon related to anomalous circulation oscillations which occurs in a decadal time scale. PDO is associated with the stability of two-phase climate patterns in the North Pacific with 50-year time period variations (Bond and Harrison, 2000). PDO is determined using the patterns of SST in the North Pacific Ocean. Southern oscillation index (SOI) is used as the primary measure of the state of the ENSO. It is computed as the normalized difference in standardized SLP anomalies between Tahiti (as a high pressure center located at 17° south and 150° west) and Darwin (as a low pressure center located at 12°south and 130° east) relative to its root mean square (Barton and Ramirez, 2004):
SOI= PTahiti -PDarwin
3-2- Climate signals data
For the study area, 40 years of rainfall and 38 years of discharge data were provided for three raingauges and hydrometric stations across Madarsoo Watershed. Data filling, where required, was performed using a multivariate regression method between the adjacent stations. Next, statistical tests were conducted for all the stations in the studied area to check the quality of data, e.g. randomness and consistency.
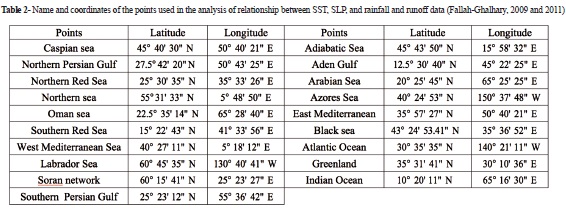
The monthly data of climate signals and SST and SLP were downloaded from (http://www.esrl.noaa.gov) and (http://www.cpc.ncep.noaa.gov) from 1972 to 2011 on 15 August, 2014. The spatial resolution for SST and SLP data was 2 degrees. In order to investigate the relationship between the variations of SST and SLP with precipitation and discharge data, some points which were proved to have more influence on Iran were studied as the indicators of each sea (Karamouz, 2005; Fallah-Ghalhary, 2009 and 2011). Location of these indicator points including the name of sea/ocean in which they are located and their coordinates are included in Table 1 (Fallah-Qalhry, 2009). Figure (2) shows the location of the indicator points used for SST and SLP data.

3-3-Correlation analysis
In this study, to assess the relationship between rainfall and discharge data and large-scaled climate signals, Pearson correlation test was utilized. To compare precipitation and discharge data with data of climate signals, all the data were standardized. The following equation was used for data standardization:
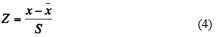
where x is the initial (unchanged) data value and x and s are average and standard deviation of data, respectively.
Pearson correlation coefficient is also called a zero-order correlation coefficient or Pearson product-moment correlation. The value of Pearson coefficients varies from 1 - to 1. If the two variables are in perfect linear relationship, the correlation coefficient will be either 1 or -1. The sign depends on whether the variables are positively (directly) or negatively (inversely) related. The correlation coefficient is 0 if there is no linear relationship between the variables.
Also, the P-values, with 0.05 significance level, were calculated to accept (reject) the statistical significance of the correlation between these two variables. The null hypothesis was that the value of r in the population was zero. If the calculated P-value was less than 0.05, the null hypothesis Ho (no correlation) would be rejected and vice versa; if P-value> 0.05, it means the correlation would be statistically significant. Correlation coefficients and P-values were calculated using OpenStat V.2013 software.
4- Results and discussion
In this section, the amount of correlation between the observed data, e.g. average monthly and maximum monthly values of precipitation and discharge data and climate signals including Nino1+2, Nino3, Nino4, Nino3. 4, MEI, TNI, AO, NAO, SOI, PDO, SST, and SLP is evaluated.
4-1- Correlation of monthly average data with climate indices
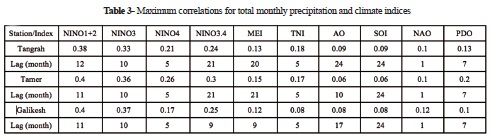
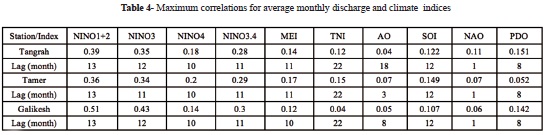
After standardizing discharge and precipitation data, values of the correlation coefficient and P-value for different lags from 1 to 24 months were calculated. Maximum values of correlation coefficient and the relevant P-values are presented in Tables (2) and (3). It can be observed from the tables that the maximum values of correlation coefficient for all the stations was derived for NINO1+2 climate index with 11 and 13 months of lag for precipitation and discharge data, respectively. NINO 1+2 indicated oscillations in the sea surface temperature in the eastern part of Pacific Ocean. The correlation between precipitation and discharge with other signals was all less than that of NINO1+2 for the study region.
4-2- Correlation of average monthly data and SST
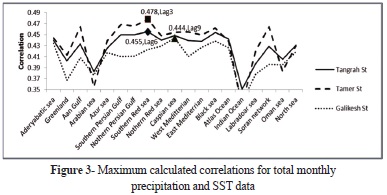
P-values and correlation coefficients between total monthly precipitation and average monthly discharge and SST with 1 to 24 months of lag were calculated. The maximum values of the correlation between SST data of different locations presented in Table 1 and precipitation and discharge data are shown in Figures (3) and (4), respectively. It can be seen that the maximum value of correlation for Tangrah and Tamer raingauges was derived for SST data of the south of Red Sea with 6 and 3 months of lag, respectively. The maximum value of correlation coefficient for Galikesh raingauge was related to SST of Caspian Sea with 9 months of lag.

For hydrometric stations, the maximum amount of correlation coefficients for Tangrah was calculated for Soran Network SST with 2 months of lag. For Tamer and Galikesh hydrometric stations, this value was derived for the SST of Greenland and Soran network with 7 and 15 months of lag, respectively.
4-3- Correlation of average monthly data and SLP
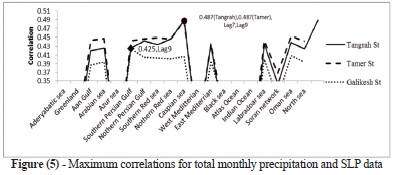
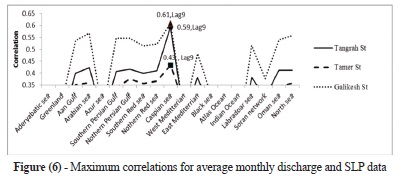
Figure (5) shows that the correlation between Tangrah and Tamer raingauges was maximum with the SLP of Caspian Sea with 7 and 9 months of lag, respectively, while for Galikesh, the maximum correlation was calculated for the SLP of the southern Persian Gulf with 9 months of lag. Also, Figure (6) demonstrates that the maximum correlation for Tangrah, Tamer, and Galikesh hydrometric stations were calculated with the SLP of Caspian Sea with 9 months of lag.
4-4- Correlation of monthly extreme data with climate signals:
P-value and correlation coefficients between maximum monthly rainfall and discharge and climate signals for different lags were calculated for every month, separately. The results for maximum correlation values for rainfall and discharge data are presented in Figures (7) and (8) as well as Tables (4) and (5), respectively.
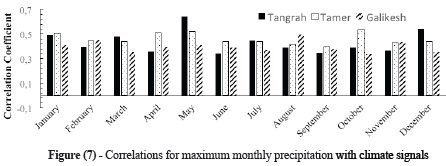
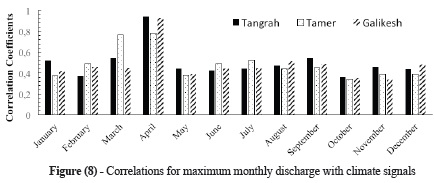
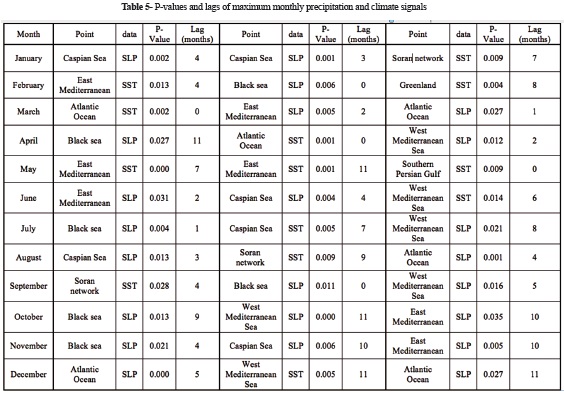
It can be seen that, for Tangrah raingauge, the highest correlation coefficient (equal to 0.641) was calculated between maximum monthly precipitation of May and SST of Eastern Mediterranean Sea with a lag of 7 months. For Tamer, the maximum correlation coefficient of 0.537 was calculated for monthly maximum precipitation of October and SLP of West Mediterranean Sea with 11 months of lag; for Galikesh, this value was 0.459 in August with a lag of 4 months with SLP of Atlantic Ocean. The next highest correlation coefficients calculated for Tangrah was 0.543 for the rainfall of December with a lag of 5 months with Atlantic SLP; for Tamer, it was 0.519 in May with the lag of 11 months with SST of Eastern Mediterranean Sea; also, for Galikesh, it was 0.456 with a lag of 4 months in August with the SLP of West Mediterranean Sea. The highest correlation coefficients were calculated as 0.937, 0.782, and 0.926 for Tangrah, Tamer, and Galikesh hydrometric stations, respectively, with a lag of 8 months between maximum monthly discharges of April and SLP of Aden Gulf. The next highest correlation value was calculated for the maximum monthly discharge of Tangrah was 0.544 with a lag of 8 months in March with Black Sea SST; for Tamer, it was equal to 0.764 with a lag of 7 months in March with SLP of Aden Gulf; also, for Galikesh, it was 0.515 with a lag of 4 months in August with SLP of Black Sea. According to these results, a significant relationship between maximum monthly precipitation and discharge data and SST/SLP signals was detected across the study region.
4-5- Discussion
In summary, the correlation between hydroclimatologic variables, e.g. average monthly rainfall, and runoff large scale climate signals, e.g. ENSO indices, was investigated at the watershed in Iran. For instance, in Galikesh raingauge, it was demonstrated that the correlation between average monthly rainfall and NINO1+2 index was maximum with the lag of 11 months. It means that, when NINO1+2 index increased (decreased), the value of precipitation in Galikesh would increase (decrease) with 11 months of lag. For Galikesh hydrometric station, the maximum correlation was observed for NINO1+2 index with a lag of 13 months. From Table 6, it can be deduced that, for average monthly data, the correlation coefficients derived for SST/SLP signals were higher than those of climate indices, e.g. NINO1+2. In other words, SST and SLP had the most influence on precipitation and discharge of the studied area. SLP of Caspian Sea had the most control on the total monthly precipitation of Tangrah and Tamer, while SST of Caspian Sea had more influence in Galikesh. For average monthly discharges in Tangrah and Galikesh, the SLP of Caspian Sea and, for Tamer, the SST of Greenland, had maximum influence. Results of the correlation analysis for extreme precipitation values also showed a very good agreement between precipitation data and SLP of Caspian Sea and Black Sea and SLP of the West and East of Mediterranean Sea. For maximum monthly discharge, the most correlations were observed for SST of Atlantic Sea and Greenland Sea and SLP of Black Sea and Caspian Sea with different lags. The highest value of correlation for maximum discharge was calculated in August with 4 months of lag with SST of Black Sea.

5- Conclusion:
In the present research, the effect of large-scale climate signals including Nino1+2, Nino3, Nino4, Nino 3.4, MEI, TNI, AO, NAO, SOI, PDO, SST, and SLP on precipitation and discharge of Madarsoo Watershed at the upstream of Golestan Dam was investigated. For this purpose, three raingauges and hydrometric stations with 40 and 38 years of daily rainfall and discharge data were selected. The correlation coefficients were calculated for total and maximum monthly precipitation and also average and maximum monthly discharge data.
In monthly scale, the maximum correlation between total precipitation and mean discharge was calculated for NINO1+2 climate index, SST of Greenland, north and south of the Persian Gulf, Southern Red Sea, SLP of Caspian Sea and SST of Soran Network. It means that these indices had maximum impact on monthly precipitation and discharge of the watershed.
For Galikesh raingauge and hydrometric station, the maximum correlation coefficients between monthly rainfall and discharge data with NINO1+2 index was calculated to be 0.4 and 0.51 with 11 and 13 months of lag, respectively. By analyzing SST data, maximum correlation coefficients for precipitation data of Tangrah, Tamer, and Galikesh raingauges was equaled to 0.455, 0.478, and 0.44 with 6, 3, and 9 months of lag, respectively. For discharge data of Tangrah, Tamer, and Galikesh hydrometric stations, the correlation values were 0.442, 0.576, and 0.552 with the lags of 2, 7, and 15 months, respectively. Analysis of SLP data showed that the maximum correlation coefficients for total precipitation data of Tangrah, Tamer, and Galikesh raingauges equaled to 0.487, 0.487, and 0.425 with 7, 9, and 9 months of lag, respectively. For discharge data of Tangrah, Tamer, and Galikesh hydrometric stations, the correlation values were 0.594, 0.433, and 0.61, respectively, all with 9 months of lag. For all the investigated large-scale climate signals, the maximum correlation coefficients between precipitation data of Tangrah and Tamer raingauges were derived with SLP of Caspian Sea while SST of Caspian Sea, has more influence in Galikesh station. For discharge data, the maximum correlation for Tangrah and Galikesh hydrometric stations was calculated for SLP of Caspian Sea. For Tamer, the correlation coefficient was obtained with Greenland SST.
The highest correlation coefficient (equal to 0.641) was calculated between maximum monthly precipitation of May and SST of Eastern Mediterranean Sea with a lag of 7 months. For Tamer, the maximum correlation coefficient of 0.537 was calculated for the monthly maximum precipitation of October and SLP of West Mediterranean Sea with 11 months of lag; for Galikesh, this value was 0.459 in August with a lag of 4 months with SLP of Atlantic Ocean. The highest correlation coefficients were calculated as 0.937, 0.782, and 0.926 for Tangrah, Tamer, and Galikesh stations, respectively, with a lag of 8 months between maximum monthly discharges of April with SLP of Aden Gulf.
It can be seen from this paper that the effect of these climatic signals is different in various areas. With regard to the results, the utilization of these signals, especially SLP and SST, can be suggested as proper predictors for forecasting the maximum and mean monthly precipitation and discharge over this region. As a result of this study, climatic signals can be used for predicting precipitation, droughts and for flood-related issues including flood forecasting and management.
References
1. Alexander, L. V., et al. (2005), Global observed changes in daily climate extremes of temperature and precipitation, J. Geophys. Res., 111, D05109, doi:10.1029/2005JD006290.
2. Angell, J. K. 1981. Comparison of variation in atmospheric quantities with sea surfase temperature variation in equatorial eastern Pacific. Mon. Wea. Rev. 109: 230.
3. Barton SB.,Ramirez JA. (2004) Effects of El Nino Southern Oscillation and Pacific Interdecadal Oscillation on Water Supply in the Columbia River Basin, Journal of Water Resources Planning and Management, 130 (4), 281-289.
4. Bond, N.A. and D.E. Harrison (2000): The Pacific Decadal Oscillation, air-sea interaction and central north Pacific winter atmospheric regimes. Geophys. Res. Lett., 27(5), 731-734.
5. Fallah-Ghalhary, Gh. A., Mousavi-Baygi M and Habibi Nokhandan M., 2009, Annual rainfall forecasting by using Mamdani Fuzzy Inference Sysytem, Research Journal of the Environmental Sciences, 3 (4), 400-413.
6. Fallah-Ghalhary, Gh. A. 2011. The assessment of the role of climate signal changes on spring rainfall oscillations, Case study: Khorasan Razavi Province. Journal of the EARTH AND SPACE PHYSICS, number 3: 155-171 (In Persian).
7. Gaucherel, C. A study of the possible extended influence of the ENSO phenomenon. Comptes Rendus Geoscience, 2004. 336(3): p. 175-185.
8. Ghayoor, H.A., and Khosravi, M. 2001. Impact of NINO\ Southern Oscillation (ENSO) on The Summer and autumnal Precipitation Anomalies in South East of Iran. Geoghrafical researches. 62:141-174. (In Persian).
9. Hughes, B.L. and A.M. Saunders. 2001. Seasonal prediction of European spring, prediction from ENSO and local SST-International. J. Climatol. 14:1-23.
10. Jochen, S. and Wolfgang, J.J. 2006. Forecasting the flood-pulse in Central Amazonia by ENSO indices.
11. Kahya, E. Dracup, J.A. 1993. US streamflow patterns in relation to the El Nin˜o/Southern Oscillation. Water Resources Research 29(8), 2491-2503.
12. Kim, W. T. Yoo, C. and Hyun, A. J. 2007, Influence of climate variation on seasonal precipitation in the Colorado River Basin, Journal of Stochastic Environmental Research and Risk Assessment, 22(3), 411-420.
13. Marshall J. Y. Kushnir, D. Battisti, P.Chang, and A. Czaja, 2001. North Atlantic ClimateVariability, Phenomena, impacts and Mechanisms. Int. Journal of Climatology, 21: 1863-1898.
14. Moron, V. M. N. Ward and A. Navarra. 2001. Observed and SST-Forced seasonal rainfall variability across tropicalAmerica. Int. J. Climatol. 21: 1467-1501.
15. Moetamedi, M., Ehteramian, K., and Shahabfar, A.R. 2007. The Study of Teleconnection Between ENSO as a Weather Signals and Rain Fall and Temperature Fluctuation's of the Khorasan Province. Environmental Science. 4:75-90. (In Persian).
16. Nazemosadat, M.J. Ghasemi, A.R. and Cordery, I. 2003. The linkage between precipitation in Iran and NSW Australia. The Proceeding of the Third Regional and First National Conference on Climate Change, Isfahan, Iran.
17. Nazemosadat, M. J. and Cordery, I. 2000, On the Relationship Between ENSO and Autumn Rainfall in Iran, Journal of Climatology, 1, 47-62.
18. Neelin, J.D., D.S. Battisti, A.C. Hirst, F.-F. Jin, Y. Wakata, T. Yamagata, and S.E. Zebiak. 1998. ENSO theory. Journal of Geophysical Research 103: 14262-14290.
19. Nicholls, N. 1989. Sea surface temperature and australian winter rainfall. J. Climate 2: 965-973.
20. Rigor, I, R. Colony, and S. Martin, 2000: Variations in Surface Air Temperature Observations in the Arctic, 1979 - 1997, J. Climate, Vol. 13, no 5, 896-914.
21. Revadekar, J.V. and Kulkarni, A. 2008, The El Nino-Southern Oscillation and winter precipitation extremes over India, Int. J. Climatol. 28: 1445-1452.
22. Roucou, P. JO. Rocha de Aragao, A. Harzallah, B. Fontaine and S. Janicot. 1996. Vertical motion changes related toNorth- East Brazil rainfall variability: A GCM simulation. Int. J. Climatol. 16: 879-892.
23. Ruigar. H, Golian. S, 2015, Prediction of precipitation in Golestan Dam Watershed using climate signals,Theoretical and Applied Climatology, DOI: 10.1007/s00704-015-1377-2.
24. Shrestha.A, Kostaschuk.R, 2005: El Nin˜o/Southern Oscillation (ENSO)-related variability in mean-monthly streamflow in Nepal. Journal of Hydrology 308, 33-49.
25. Smolinski, K.K, July 2004: "Interrelationship Among Larg Scale Atmospheric Circulation Regimes and Surface Temprature Anomalies in the North Amer- ican Arctic, A Thesis Presented to the Academic Faculty". School of Earth and Atmospheric Sciences.
26. Tabatabee-Yazdai, J. Rezaee-Pazhand, H. and Khatami-Mashhadi, H. 2010. Runoff regression models for small catchments. J. Water and Soil. 23:4.193-204.
27. Walker,G.T. and E. W. Bliss,1932: World weather V. Mem. Roy. Meteorol. Soc. 4, 53-84.
28. Wolter, K., 1987, The Southern Oscillation in surface circulation and climate over the Atlantic, eastern Pacific, and Indian Oceans, as captured by cluster analysis. J. Clim. Appl. Meteorol.26, pp. 540-558.
29. Yarahmadi, D., and Azizi, G.H. 2007. Analytical Relationship Between Seasonal Rainfall in Iran and Climate Index. Geoghrafical researches, number 62: 161-174. (In Persian)
How to Cite
APA
ACM
ACS
ABNT
Chicago
Harvard
IEEE
MLA
Turabian
Vancouver
Download Citation
CrossRef Cited-by
1. Leone Bastiancich, Manuela Lasagna, Susanna Mancini, Mauro Falco, Domenico Antonio De Luca. (2022). Temperature and discharge variations in natural mineral water springs due to climate variability: a case study in the Piedmont Alps (NW Italy). Environmental Geochemistry and Health, 44(7), p.1971. https://doi.org/10.1007/s10653-021-00864-8.
2. Vishal Singh, Xiaosheng Qin. (2020). Study of rainfall variabilities in Southeast Asia using long-term gridded rainfall and its substantiation through global climate indices. Journal of Hydrology, 585, p.124320. https://doi.org/10.1016/j.jhydrol.2019.124320.
3. Fereshteh Modaresi, Kumars Ebrahimi, Ali Danandeh Mehr. (2024). A novel approach to predictor selection among large-scale climate indices for seasonal rainfall forecasting in small catchments. Hydrological Sciences Journal, 69(4), p.488. https://doi.org/10.1080/02626667.2024.2313572.
4. Lierk Kalyany Silva de Sousa, Vânia Ferreira Roque-Specht, Eduardo Monteiro de Castro Gomes. (2020). Principais Direcionadores de Compra de Carnes em Hipermercados. Revista de Administração Contemporânea, 24(4), p.335. https://doi.org/10.1590/1982-7849rac2020190097.
5. Adimasu Woldesenbet Worako, Alemseged Tamiru Haile, Meron Teferi Taye. (2021). Streamflow variability and its linkage to ENSO events in the Ethiopian Rift Valley Lakes Basin. Journal of Hydrology: Regional Studies, 35, p.100817. https://doi.org/10.1016/j.ejrh.2021.100817.
6. Neekita Joshi, Ajay Kalra. (2021). Analyzing the Association between ENSO and Groundwater Rise in the South Atlantic-Gulf Region in the Southeastern United States. Hydrology, 8(3), p.119. https://doi.org/10.3390/hydrology8030119.
7. Xiaowei Wei, Hongbo Zhang, Xinghui Gong, Xingchen Wei, Chiheng Dang, Tong Zhi. (2020). Intrinsic Cross-Correlation Analysis of Hydro-Meteorological Data in the Loess Plateau, China. International Journal of Environmental Research and Public Health, 17(7), p.2410. https://doi.org/10.3390/ijerph17072410.
8. Dhiraj Kumar Singh, Kamal Kant Singh, George P. Petropoulos, Priestly Shan Boaz, Prince Jain, Sartajvir Singh, Dileep Kumar Gupta, Vishakha Sood. (2023). Spatiotemporal Vegetation Variability and Linkage with Snow-Hydroclimatic Factors in Western Himalaya Using Remote Sensing and Google Earth Engine (GEE). Remote Sensing, 15(21), p.5239. https://doi.org/10.3390/rs15215239.
Dimensions
PlumX
Article abstract page views
Downloads
License
Earth Sciences Research Journal holds a Creative Commons Attribution license.
You are free to:
Share — copy and redistribute the material in any medium or format
Adapt — remix, transform, and build upon the material for any purpose, even commercially.
The licensor cannot revoke these freedoms as long as you follow the license terms.