


Published
Optimization of pulsed vacuum osmotic dehydration of the cape gooseberry (Physalis peruviana L.) using the response surface methodology
Optimización de la deshidratación osmótica a vacío pulsante de uchuva (Physalis peruviana L.) por medio de la metodología de superficies de respuesta
DOI:
https://doi.org/10.15446/agron.colomb.v34n2.54920Keywords:
kinetic parameters, mass transfer, osmotic pressure, pulsed vacuum, Fick’s law. (en)Parámetros cinéticos, transferencia de masa, presión osmótica, pulsos de vacío, ley de Fick (es)
Downloads
El objetivo de este estudio fue optimizar la transferencia de masa durante la deshidratación osmótica a vacío pulsante (DOVP) de uchuvas (Physalis peruviana L.) mediante la metodología de superficies de respuesta. Se evalúo el efecto de temperatura (25-45°C), sólidos (50-70°Brix), velocidad de rotación (60-100 rpm), presión (50-100 mBar) y número de pulsos de vacío (1-3) sobre los parámetros de deshidratación osmótica pérdida porcentual de peso (%PP), pérdida porcentual de humedad (PH) y ganancia porcentual de sólidos (GS). Se utilizó jarabe de sacarosa en relación jarabe/fruta de 5/1 durante 2 horas. Los resultados entregaron como condiciones óptimas 45°C, 70°Brix, 99,99 rpm, 98,92 mbar y 2,87 pulsos de vacío, para una %PP de 47,52%, %PH de 21,12% y %GS de 118,40. A las condiciones óptimas se ajustaron modelos matemáticos para describir la cinética de DOVP de uchuvas. Se utilizó el modelo empírico de penetración de Azuara, un modelo fenomenológico a partir de la solución de la segunda ley de Fick y el modelo empírico de Peleg. Siendo este último el modelo que mejor ajustó los datos experimentales.
Doi: https://doi.org/10.15446/agron.colomb.v34n2.54920
Optimization of pulsed vacuum osmotic dehydration of the cape gooseberry (Physalis peruviana L.) using the response surface methodology
Optimización de la deshidratación osmótica a vacío pulsante de uchuva (Physalis peruviana L.) por medio de la metodología de superficies de respuesta
José Edgar Zapata M.1, Gelmy Luz Ciro G.1, and Paulina Marulanda L.1
1 Departamento de Alimentos, Facultad de Ciencias Farmacéuticas y Alimentarias, Universidad de Antioquia. Medellin (Colombia). jedgar_4@yahoo.es
Received for publication: 24 December, 2015. Accepted for publication: 30 June, 2016.
ABSTRACT
The objective of this study was to optimize mass transfer during pulsed vacuum osmotic dehydration (PVOD) of cape gooseberries (Physalis peruviana L.) by means of the surface response methodology. The effects of the factors temperature (25-45°C), solids (50-70°Brix), rotation speed (60-100 rpm), pressure (50-100 mbar) and number of vacuum pulses (1-3) on osmotic dehydration, weight reduction percentage (WR), water loss percentage (WL), and solid gain percentage (SG%) were assessed. Sucrose syrup at a 5/1 syrup/fruit ratio was used for 2 h. The results provided 45°C, 70°Brix, 99.99 rpm, 98.92 mbar and 2.87 pulse vacuum, for a WR of47.52%, WL of 21.12%, and SG of 118.40% as the optimal conditions. Mathematic models were adjusted to the optimal conditions to describe the PVOD kinetics of cape gooseberries. Azuara's penetration empiric model, a phenomenological model from the solution of Fick's second law, and Peleg's empiric model were used. The latter adjusted better to the experiment data.
Key words: Kinetic parameters, mass transfer, osmotic pressure, pulsed vacuum, Fick's law.
RESUMEN
El objetivo de este estudio fue optimizar la transferencia de masa durante la deshidratación osmótica a vacío pulsante (DOVP) de uchuvas (Physalis peruviana L.) mediante la metodología de superficies de respuesta. Se evalúo el efecto de temperatura (25-45°C), sólidos (50-70°Brix), velocidad de rotación (60-100 rpm), presión (50-100 mBar) y número de pulsos de vacío (1-3) sobre los parámetros de deshidratación osmótica pérdida porcentual de peso (%PP), pérdida porcentual de humedad (PH) y ganancia porcentual de sólidos (GS). Se utilizó jarabe de sacarosa en relación jarabe/fruta de 5/1 durante 2 horas. Los resultados entregaron como condiciones óptimas 45°C, 70°Brix, 99,99 rpm, 98,92 mbar y 2,87 pulsos de vacío, para una %PP de 47,52%, %PH de 21,12% y %GS de 118,40. A las condiciones óptimas se ajustaron modelos matemáticos para describir la cinética de DOVP de uchuvas. Se utilizó el modelo empírico de penetración de Azuara, un modelo fenomenológico a partir de la solución de la segunda ley de Fick y el modelo empírico de Peleg. Siendo este último el modelo que mejor ajustó los datos experimentales.
Palabras clave: Parámetros cinéticos, transferencia de masa, presión osmótica, pulsos de vacío, ley de Fick.
Introduction
Colombia is the first world producer of the cape gooseberry (Physalis peruviana L.), a perennial plant, native to the South American Andes (Fischer et al., 2014), the second rank export fruit in this country (Márquez et al., 2009). It is a juicy pulpy berry with high levels of minerals, Fe and P, vitamins A and C, and fiber, among others (Marín et al., 2010). Its metabolites have shown hepatoprotective (Arun and Asha, 2007), anti-inflammatory (Wu et al., 2006), antioxidant (Stangeland et al., 2009; Wu et al., 2005), human hepatoma cell antiproliferative, anticarcinogenic (Wu et al., 2004a; Wu et al., 2004b) and anti-diabetic (Ryan et al, 2001) activities, among others (Restrepo et al., 2009). Losses from postharvest management represent between 20 and 25% of fruit production in developed countries and is even higher in developing ones, because of transport and storage problems (Zhu, 2006; Sharma et al., 2009). In the specific case of the Colombian cape gooseberry, 50% of the total production is not exportable because of the size (Castro et al., 2008) and may be used to make new products. Nevertheless, published studies on the cape gooseberry preservation methods are scarce (Castro et al., 2008).
Osmotic dehydration (OD) is a food preservation technique based on the reduction of water activity and moisture, in which the product is submerged in a solution with a high osmotic pressure, which creates a chemical potential gradient between the water/solute contained in the food and the water/solute outside the solution, generating a water flow from inside the product and to a lesser extent, entrance of solutes from the solution outside (Peiró et al., 2007), to reduce the difference in their chemical potentials in both sides of the vegetable cell membranes (Bekele and Ramas-wamy, 2010). This technique presents advantages over other dehydration techniques since it preserves the sensorial and nutritional characteristics of the product (Peiró et al., 2007; Ozdemir et al., 2008; Chavan and Amarowicz, 2012). OD simultaneously includes processes of water reduction and solute gain (Saxena, et al., 2009; Bekele and Ramaswamy, 2010) , in which mass transfer depends on pressure (Reyes et al., 2008; Corrêa et al., 2010), temperature (Zapata et al., 2011) , solute concentration (Zapata and Montoya, 2012), syrup/fruit ratio (Akbarian et al., 2014) and agitation, among other variables (Reyes et al., 2008).
In recent decades, some researchers have worked on using OD vacuum to accelerate mass transfer in products such as sardine sheets (Reyes et al., 2008), melon (Fermin and Corzo, 2005), higos (Arreola and Rosas, 2007) and mango (Huayamave and Cornejo, 2005), among others (Mújica et al., 2003a).
Considering low investment cost, and easy implementation (Zapata et al., 2004), low energy consumption (Khan, 2012; Akbarian et al., 2014), as well as organoleptic and nutritional quality of the products obtained with OD (Peiró et al., 2007; Ozdemir et al., 2008; Chavan and Amarowicz, 2012) , this technique represents an excellent alternative of preservation in rural areas, which would increase the income level of growers, as it would allow them to use lower quality fruits and give them added value. Response surfaces are very effective tools in optimization, which have been used in different food processes among which is OD (Valdez et al., 2007; Ozdemir et al., 2008; Chauhan et al., 2009). Their principal advantage is the reduction in the number of experiments necessary to obtain statistically valid results (Ozdemir et al., 2008), which are also faster and contain more information than the classical ones in which variables are assessed one at a time (Ozdemir et al., 2008).
The objective of the current study was to optimize the OD at pulsed vacuum (PVOD) of the cape gooseberry (Physalis peruviana L.) by means of response surface methodology. Furthermore, mathematic models were fitted to describe the behavior of the system in terms of the PVOD kinetic.
Materials and methods
Raw material preparation
Fresh cape gooseberry fruits (Physalis peruviana L.) were bought in a local market of Medellin, located at 6°13'55" N and 75°34'05" W. The origin of fruits were from farms at altitudes between 1,200 and 2,800 m a.s.l. Fruits with weights between 3 and 4 g and a soluble solid content between 14 and 15°Brix were selected, washed with alkaline detergent and disinfected with 4% quaternary ammonium; finally, they were peeled to facilitate mass transfer and physico-chemically characterized (AOAC, 1995) (Tab. 1).

Experiment design and statistical analysis of the cape gooseberry fruit PVOD
Osmotic solution and peeled cape gooseberry fruits were placed in a glass balloon with rotatory movement around an axis coupled to the vacuum input of a rotary evaporator (Büchi R-124, Switzerland), for 2 h. The ratio between the weight of the osmotic solution and the fruit was 5:1.
The response surface methodology (RSM) was applied to assess the effect of the factors: temperature (T: 25-45 °C), syrup solid concentration (B: 50-70 °Brix), rotation speed (S: 60-100 rpm), pressure (P: 60-100 mbar) and vacuum pulse (VP: 1-3) over the most important parameters of the cape gooseberry fruit PVOD process: weight reduction percentage (WR), water loss percentage (WL), and solid gain percentage (SG), according to the following Eqs. 1, 2 y 3:
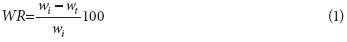

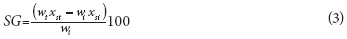
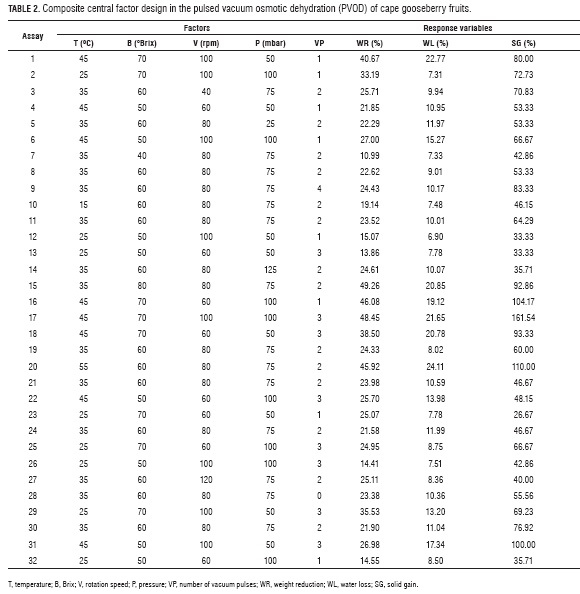
Where wi is the initial weight and wt the weight at t time, xwi and xsi are the initial moisture and solid fractions of the samples, respectively, xwt and xst are the moisture and solid fractions at t time of the samples, respectively. Thirty-two runs were performed according to a composite central factorial design, 2k-1 + star, with six central points and two axial ones as shown in Tab. 2. The experiment data were analyzed using software Design-Expert 7.0 (Estat Ease, Minneapolis, MN). A second order polynomial equation was used to express response variables as a function of the factors as follows:
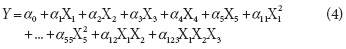
Where Y are the response variables (WR, WL or SG), an are the model parameters and X1, X2, X3, X4 y X5 are T, B, V, P and VP factors, respectively.
A VP corresponds to a vacuum for 5 min and relaxation of 10 min at atmospheric pressure. Each of the experiment unit was subjected to VP at first and then kept at an atmospheric pressure for 2 h, under the operational condition, as Tab. 2 indicates. Finally, the samples were dried and the solution on the surface was smoothly removes with paper towel. Samples were analyzed in water content, using an oven of forced air, model termolab 53® (Binder, Portugal), °Brix with a refractometer LR 45227® (Milton Roy Company, Ivyland, PA), and weight with an analytic scale CP 2245® (Sartorius, Göttingen, Germany).
The analysis of variance (ANOVA) was made with a confidence level of 95%. Polynomial models were optimized to determine the levels of the factors that maximize WR, WL or SG.
Cape gooseberry fruit PVOD kinetic modeling
Assays were made to the optimal conditions found in the previous section to establish the kinetic behavior during the cape gooseberry PVOT for 4 h. Kinetic modeling was done using three different strategies: A penetration empirical model, proposed by Azuara et al, (1992); a phenomenological model from the solution of Fick's second law (Crank, 1975) and Peleg's empirical model.
Penetration empirical model
The model was based on mass balance to predict dehydration kinetics during the osmotic process, which determines the final equilibrium point, according to Eqs. 5 and 6.

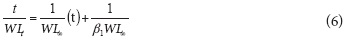
where WLt is the water/weight loss at time t, WL∞ is the corresponding quantity at infinite time (i.e., at equilibrium) and β1 (min-1) is the constant related to the rate of diffusion of water out. The equilibrium water loss (WL∞ and model constant β1 were estimated from the slope and intercept of the plot (t/WLt) versus t (min) equation (6).
Similarly, Eq. 7 and 8 show the expression to solute gain:
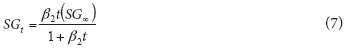

were SGt, is the solute gain at time t, SG∞ is the corresponding quantity at infinite time (i.e., at equilibrium) and β2 (min-1) is the constant related to the rate of solute transport to inside.
The equilibrium solute gain (SG∞ and model constant β2 were estimated from the slope and intercept of the plot (t /SGt) versus t of equation (8).
Phenomenological model
To determine the effective diffusivity (Def) of the water and solute, a phenomenological model based on Fick's second law for diffusion in an unsteady-state was used (Assis et al., 2016). To solve Fick's equation, the following considerations were taken into account: spherical geometry, water or solid initial content (MC0), diffusivity and concentration in constant interphases, the resulting model is showen in Eq. 9 (Crank, 1975).

where Def is the diffusive coefficient of water reduction or solute gain (m2/s); i is the end of the series number; r is the average radius of samples (m); t is the time (s); WA orS is water loss or solid gain dimensionless, which may be calculated with expression (10):
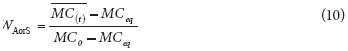
where MC0 is the water or solid content at the beginning (g); MC(t) is the water or solid content in the time instant t (g); MCeq is the amount of water or solids in equilibrium (g), obtained from the model of Azuara et al. (1992) with Eqs. 6 and 8.
Peleg's empirical model
Peleg (1988) proposed an equation to describe sorption curves that approach to equilibrium asymptotically. Park et al. (2002) rewrote the same equation as:

here t is the time, h, k1 and k2 are Peleg's constants.
The quality of the fit of the models was assessed with a linear correlation coefficient (R2) and the mean relative percentage error (MRPE) (Eq. 12); both are statistic parameters widely used in food (Zapata et al., 2014).

where Xei is the experiment value; Xci is the estimated value from every model and n is the number of observations.
Results and discussion
Cape gooseberry fruits PVOD process optimization using response surfaces
Table 2 shows the 32 random experimental runs of the composite central factor design used to assess T, B, V, P and VP effects on the WR, SG and WL.
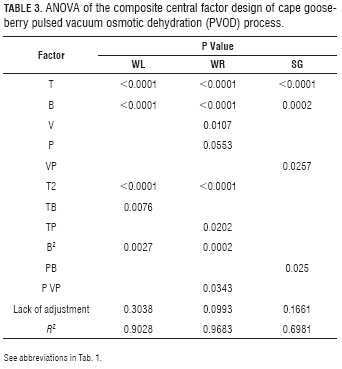
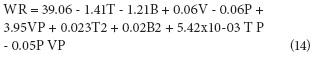
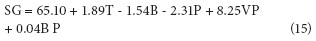
While Tab. 3 shows the ANOVA, equations 13 to 15 show the fitted models for WR, SG and WL in function of the factors. The R2 (> 0.90) obtained for WR and WL suggests that these polynomial equations adequately represented the existing relationship between responses and factors with statistically significant effects (P≤0.05), while the R2 for SG (0.6981) was the less representative value.

Factor effects on WL and WR in PVOD of cape gooseberry
Taking into consideratios that it is a dehydration process, water that exits the fruit becomes one of the most important parameters to assess, as well as the weight reduction percentage (WR), which indirectly measures the water reduction in the osmodehydrated product, important variables in transportation and storage of great volumes of product.
ANOVA's composite central factorial design (Tab. 3) showed factors with a significant effect on the WR and WL variables, which are: T in its lineal (P<0.0001) and quadratic (P<0.0001) term, with negative and positive effects, respectively (13 and 14). Likewise, B significantly affected WR and WL in their lineal term (P<0.0001), with a negative effect on both variables. B, in its quadratic term, had a higher significance on WR (P=0.0002) than on WL (P=0.0027), but, in both cases, the effect was positive. The B effect is explained by the osmotic pressure gradient between the fruit and the osmotic solution, which causes the exit of water from inside the fruit (Corrêa et al., 2010), the difference between lineal and quadratic terms indicate the existence of a maximum point in the T range used in the current work.
The V factor had an effect on WR on its lineal term (P=0.0107) with a positive effect, this was due to the fact that OD can be enhanced by agitation or circulation of the syrup around the sample (Bekele and Ramaswamy, 2010). It can also be observed that there are significant interactions between T with B (P=0.0076) and with P (P=0.0202) on WL and WR, respectively, with positive effects in both variables. While a significant interaction, was only found between P with VP (P=0.0343) in WR, with a negative effect.
Figures 1a and 1b show the response surface graphics for WL and WR in the PVOD process. The graphs show the B and T factors interactions have over both variables, when P (75 mbar), V (80 rpm) and VP (2) factors stay constant.
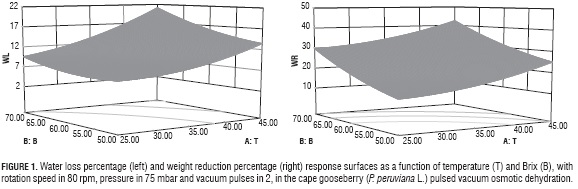
It can be seen in both graphs that, as B and T increased, WL and WR did too, until reaching top values when B had 70°Bx and T was 40°C. The effects these two variables on WL and WR, is due to the fact that their increments favor the exit of water from the fruit (Lombard et al., 2008; Bekele and Ramaswamy, 2010), associated to its effect over mass transfer and Def during OD (Alakali et al., 2006) even in systems submitted to pulsed vacuum (Arreola and Rosas, 2007; Allali et al, 2010).
Factor effects on SG in PVOD of cape gooseberry
Solid gain (SG) is an important parameter in OD, because in some cases its increment is an undesirable phenomenon as it may be associated to organoleptic properties and product caloric content changes (Jalaee et al., 2011; Phisut, 2012); besides, it may favor the creation of a barrier in the surface of the product negatively affecting mass transfer in the system (Giraldo et al., 2003). On the other hand, if the idea is to cut down weight reduction in the product to avoid meaningfully affecting cost, an elevated SG may be desirable as it happens in glazed products (Giraldo et al., 2003). Table 3 shows factors with significant effects on the SG response variable include: in their lineal terms T (P<0.0001), B (P=0.0002) and VP (P=0.0257) and the interaction of P with B (P=0.025).
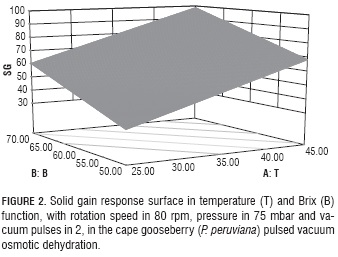
Equation 15 shows T has a positive effect on SG, which indicates this variable favors the entrance of solids in the fruit as an effect of its action on the diffusion coefficients (Alakali et al., 2006; Arreola and Rosas , 2007; Allali et al., 2010; Tortoe, 2010), while B had a negative effect, which is associated with the fact that high B values negatively affect the entrance of solids when favoring the creation of a barrier on the surface of the membranes of the product (Giraldo et al., 2003; Mujica - Paz et al., 2003; Ferrari y Hubinger, 2008). The VP factor had a significant positive effect over SG, which indicates the greater the number of applied vacuum pulses, the higher the gains in solids due to vacuum pulses provoke the opening of the fruit pores and the exit of entrained air. When the atmospheric pressure is restored, such pores are filled with the osmotic solution which affect the fruit solid gain (Huayamave and Cornejo, 2005; Arreola and Rosas, 2007). The P and B interaction had a positive effect on SG, possibly because the pressure reduction caused the expansion and exit of gas enclosed in the pores, and pores can be occupied by osmotic solution, thus increasing the mass transfer rate (Bekele and Ramaswamy, 2010), when increasing the vacuum this process increases too. On the other hand, the solution that entered the pores may exit along with the original liquid during the relaxation period at atmospheric pressure, but with concentrated solutions, the exit of the solute does not happen the same way, resulting in a higher SG (Mújica et al., 2003a). (Mújica et al., 2003b). To corroborate this behavior, note the graph for SG as a function of the more significant factors (T and B), V (80 rpm), VP (2) and pressure (75 mbar) values were noted (Fig. 2).
Model optimization
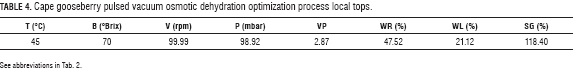
Equations 13, 14 and 15 were submitted to a maximization process to determine the combination of experimental factors which will simultaneously optimize the three response variables. This process aimed WR and WL were top, while SG were in moderated levels not to affect in an extreme way the flavor and caloric level of the product but do look for its top stability when reducing moisture. The levels of the factors predicted by models (Eqs. 13, 14 and 15) to maximize the response variables WR and WL are show in Tab. 4.
Cape gooseberry fruit PVOD behavior in time function
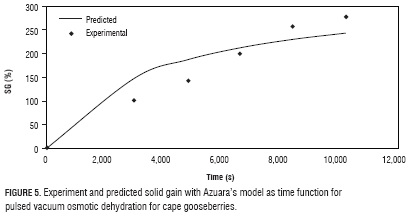
With the values defined in the optimization (Tab. 4), taking a vacuum pulse number 3, PVOD process was performed twice, registering data during 4 h (Figs. 3, 4 and 5). In these figures, at 6,600 s, WR, WL and SG, had values of 51.18%; 31.05% and 200.00%, respectively, all values higher to the predicted for the optimization process to 7,200 s (Tab. 4), corroborating the validity of the models obtained in the experimental design and the optimization process. The top values obtained at the end of the assay (10,200 s) were 58.16%, 38.45%, and 278.57%, for WR, WL and SG, respectively. In the case of WR and WL, their maximization is convenient for the preservation of the fruit, as they are associated with the reduction of the water available (water activity) for the development of microorganisms and enzymatic reactions (Zapata et al., 2004; Tiganitas et al., 2009), also reduce cost in transportation and storage. On the other hand, the high SG values, although associated with higher preservation, are not favorable because of their effect on flavor and caloric content.


The most significant changes in WR and WL appeared in the first 5,400 s (Figs. 3 and 4), while SG does not present such change in its graphic behavior (Fig. 5). WR and WL behavior approaches what has typically been observed in fruit OD (Alakali et al., 2006); Ngoran et al., 2009). Nevertheless, fast rising times are lower to the reported for other fruits in OD without vacuum application (Zapata et al., 2011; Zapata and Montoya, 2012), possibly due to the applied vacuum.
OD kinetic parameter behavior observed in Figs. 3 and 4 may be explained considering the first OD moments there are differences in the chemical potential of the species participating in the system (sucrose and water). The fruit interior had a greater water chemical potential and a lower solute one than the solution in the exterior. These differences driving force the movement of solutes inside and water outside the fruit (Ozdemir et al., 2008; Lombard et al., 2008). As the process time goes by, the substance entrance and exit causes a chemical potential differences reduction, taking the system closer to equilibrium, thus reducing entrance and exit of matter slowly until near zero, just as the driving force propelling mass transfer reduces (Ozdemir et al., 2008).
The exit of water reduces weight and moisture while the solids of the product increase, that is, all kinetic parameters increase (WR, WL and SG). With the solute entrance, weight and solids increase, but moisture reduces, put in other way, WR reduces and the other parameters rise. At the beginning of the process (first 4,800 s) high water exit predominates over the solute entrance, which promotes increments in all kinetic parameters, while at the end of the process both, material entrance and exit, practically stop as the system reaches equilibrium, and therefore kinetic parameters keep stable (Figs. 3, 4 and 5).
Dehydration kinetic modeling
Experiment data presented in Figs. 3, 4 and 5 were used and adjusted with Eqs. 5-11.
Empirical penetration model
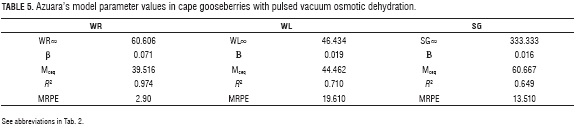
Table 5 shows the parameter values of Azuara's model obtained from adjusting experimental data with Eqs. 5 and 7. Figures 3, 4 and 5 show the graphic behavior of the experiment and predicted data with Azuara's penetration model. Both, R2 and graphic behavior values, indicate an adequate setting of the experiment data with Azuara's model.
Phenomenological model
Experiment data setting of WA and WS (Figs. 6 and 7) with equations 9 and 10, delivered the values of the effective diffusivity for water reduction and solute gain, Def, a = 1.47 x 10⁻⁹ and Def, s = 1.25 x 10⁻⁹, with MRPE of 11.46 and 20.20, respectively. The higher value of Def,s with respect to Def,a can be explained with base in opening of the fruit pores by effect of the vacuum pulses, which when atmospheric pressure is restored, are filled with the osmotic solution accelerating the solid gain (Huayamave and Cornejo, 2005; Arreola and Rosas, 2007). These values are in the same magnitude order of typical values reported in literature for different fruits and vegetables (Giraldo et al., 2004; Maldonado et al., 2008; Melquíades et al., 2009; Rastogi and Raghavarao, 2004).
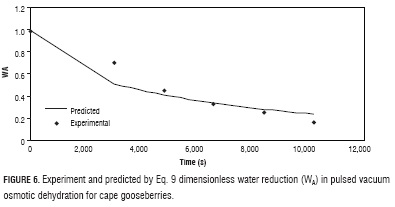
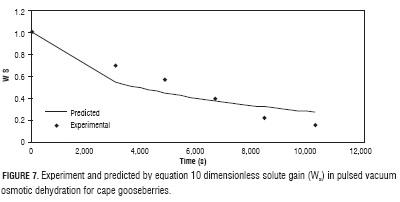
Using the effective diffusivity values in equations 9 and 10, respectively, phenomenological model predicted values obtained deriving from Fick's equation solution (Crank, 1975) (Figs. 6 and 7).
Peleg's empirical model
Table 6 shows the parameters obtained with the setting of moisture and total solids experiment data in Peleg's equation (Eq. 10), as well as the R2 of each setting, and in the Figs. 8 and 9 the experiment values against the ones predicted by Peleg's equation for moisture and total solids, respectively.
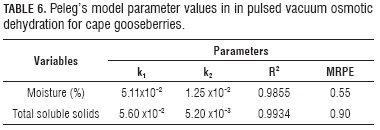


The R2 values (Tabs. 5 and 6), MRPE and analysis of graphic behavior (Figs. 3-9), showed the best adjust for the experiment data to the Peleg model, during cape gooseberry PVOD under current study conditions, followed by model derived from Fick's equation and finally by the Azuara model. Nevertheless, the Peleg model, as an empiric model, does not provide a deeper understanding of the phenomenon, while the two others do, which is very usefully to scale up process and to extrapolate results. Additionally, it must be considered generality involved in the phenomenological model derived from Fick's equation even without the best statistics. In any case, the excellent fit of Peleg model allow appreciate the application of this model in this process under condition set out in this study.
Conclusion
Operation conditions significantly affect the PVOD of cape gooseberries, principally temperature and °Bx affect WR and WL, while VP affects SG.
This process can be modeled through empirical and phenomenological models with satisfactory results and, in this way, sets out parameters to scale up the process.
Acknowledgments
The authors thank the Comité para el Desarrollo de la Investigación (CODI) of Universidad de Antioquia in its Sustainability Program 2014/2015 for funding this project.
Literature cited
Akbarian, M., N. Ghasemkhani, and F. Moayed. 2014. Osmotic dehydration of fruits in food industrial: A review. Int. J. Biosci. 4(1), 42-57. Doi: 10.12692/ijb/4.1.42-57.
Alakali, J.S., C.C. Ariahu, and N.N. Nkpa. 2006. Kinetics of osmotic dehydration of mango. J. Food Process. Preserv. 30(5), 597-607. Doi: 10.1111/j.1745-4549.2006.00080.x.
Allali, H., L. Marchal, and E. Vorobiev. 2010. Effects of vacuum impregnation and ohmic heating with citric acid on the behaviour of osmotic dehydration and structural changes of apple fruit. Biosyst. Eng. 106(1), 6-13. Doi: 10.1016/j. biosystemseng.2009.08.005.
AOAC. 1995. Official methods of analysis of AOAC international. 16th ed. Gaithersburg, MD.
Assis F, R. Morais, and A. Morais. 2016. Mass transfer in osmotic dehydration of food products: comparison between mathematical models. Food Eng. Rev. 8(2), 116-133. Doi: 10.1007/ s12393-015-9123-1.
Arreola, S.I. and M.E. Rosas. 2007. Aplicación de vacío en la deshidratación osmótica de higos (Ficus carica). J. Inf. Technol. 18(2), 43-38. Doi: 10.4067/S0718-07642007000200006.
Arun, M. and V.V. Asha. 2007. Preliminary studies on antihepatotoxic effect of Physalis peruviana Linn. (Solanaceae) against carbon tetracloride induced acute liver injury in rats. J. Ethnopharmacol. 111(1), 110-114. Doi: 10.1016/j.jep.2006.10.038.
Azuara, E., C.I. Beristain, and H.S. Garcia. 1992. Development of a mathematical model to predict kinetics of osmotic dehydration. J. Food Sci. Technol. 29(4), 239-242.
Bekele, Y. and H.S Ramaswamy. 2010. Going beyond conventional osmotic dehydration for quality advantage and energy savings. Ethiop. J. Appl. Sci. Technol. 1(1), 1-15.
Castro, A.M., L. Rodríguez, and E.M Vargas. 2008. Secado de Uchuva (Physalisperuviana L.) por aire caliente con pretratamiento de osmodeshidratación. Vitae 15(2), 226-231.
Chauhan, O.P., A. Shah, A. Singh, P.S Raju, and A.S Bawa. 2009. Modeling of pre-treatment protocols for frozen pineapple slices, LWT-Food Sci. Technol. 42(7), 1283-1288. Doi: 10.1016/j.lwt.2009.02.019.
Chavan, U.D. and R. Amarowicz. 2012. Osmotic dehydration process for preservation of fruits and vegetables. J. Food Res. 1(2), 202-209. Doi: 10.5539/jfr.v1n2p202.
Corrêa, J.L.G., L.M. Pereira, G.S. Vieira, and M.D. Hubinger. 2010. Mass transfer kinetics of pulsed vacuum osmotic dehydration of guavas. J. Food Eng. 96(4), 498-504. Doi: 10.1016/j. jfoodeng.2009.08.032.
Crank, J. 1975. The mathematics of diffusion. 2nd ed. Oxford University Press, London.
Fermin, W.J. and O. Corzo. 2005. Optimization of vacuum osmotic dehydration of cantaloupe using response surface methodology. J. Food Process. Preserv. 29(1), 20-32. Doi: 10.1111/j.1745-4549.2005.00010.x.
Ferrari, C.C. and M.D. Hubinger. 2008. Evaluation of the mechanical properties and diffusion coefficients of osmodehydrated melon cubes. Int. J. Food Sci. Technol. 43 (11), 2065-2074. Doi:10.1111/j.1745-4549.2005.00010.x.
Fischer, G., P.J. Almanza-Merchán, and D. Miranda. 2014. Importancia y cultivo de la uchuva (Physalisperuviana L.). Rev. Bras. Frutic. 36(1), 1-15. Doi: 10.1590/0100-2945-441/13.
Giraldo, D.P., L.M Arango, and C.J Márquez. 2005. Osmodehydration of Blackberry (Rubus glaucus Benth) with three sweetening agents. Rev. Fac. Nal. Agron. 57(1), 2257-2274.
Giraldo, G., P. Talens, P. Fito, and A. Chiralt. 2003. Influence of sucrose solution concentration on kinetics and yield during osmotic dehydration of mango. J. Food Eng. 58(1), 33-43. Doi: 10.1016/S0260-8774(02)00331-X.
Huayamave, E.C. and F. Cornejo. 2005. Influencia de presiones de vacío en la transferencia de masa durante la deshidratación osmótica del mango. Rev. Tecnol. ESPOL 18(1), 141-145.
Jalaee, F., A. Fazeli, H. Fatemian, and H. Tavakolipour. 2011. Mass transfer coefficient and the characteristics of coated apples in osmotic dehydrating. Food Bioprod. Process. 89(4), 367-364. Doi: 10.1016/j.fbp.2010.09.012.
Khan, M.R. 2012. Osmotic dehydration technique for fruits preservation - A review. J. Food Sci. 22(2), 71-85.
Lombard, G.E., J.C. Oliveira, P. Fito, and A. Andrés. 2008. Osmotic dehydration of pineapple as a pre-treatment for further drying. J. Food Eng. 85(2), 277-284. Doi: 10.1016/j.jfoodeng.2007.07.009.
Maldonado, S., J.E Santapaola, J. Singh, M. Torrez, and A. Garay. 2008. Cinética de la transferencia de masa durante la deshidratación osmótica de yacón (Smallanthus sonchifolius). Food Sci. Technol. 28(1), 251-256. Doi: 10.1590/ S0101-20612008000100036.
Marín, Z., M. Cortés, and O. Montoya. 2010. Evaluación sensorial de uchuva (Physalisperuviana L.) ecotipo Colombia impregnada con la cepa nativa Lactobacillus plantarum lpbm10 y la cepa comercial Lactobacillus casei ATCC 393. Vitae 17(1), 21-28.
Marquez, C.J., O. Trillos, J.R Cartagena, and J.M Cotes. 2009. Evaluación físico-química y sensorial de frutos de Uchuva (Physalis peruviana L.). Vitae 16(1), 42-48.
Melquíades, Y.I, C. López, and M.E. Rosas. 2009. Estudio de la cinética de rehidratación de zanahoria (Daucus carota) deshidratadas. Inf. Tecnol. 20(3), 65-72. Doi: 10.1612/inf.tecnol.4037it.08.
Mújica, H., A. Valdez, A. López, E. Palou, and J. Welti. 2003a. Impregnation and osmotic dehydration of some fruits: effect of the vacuum pressure and syrup concentration. J. Food Eng. 57(4), 305-304. Doi: 10.1016/S0260-8774(02)00344-8.
Mújica-Paz, H., A. Valdez-Fragoso, A. LópezMalo, E. Palou, and J. Welti-Chanes. 2003b. Impregnation and osmotic dehydration of some fruits: effect of thevacuum pressure and syrup concentration. J. Food Eng. 57, 305-314. Doi: 10.1016/S0260-8774(02)00344-8.
Ngoran, B.Z., E. Assidjo, P. Kouamé, I. Dembele, and B. Yao. 2009. Modelling of osmotic dehydration ofmango (Mangifera indica) by recurrent artificial neural network and experimental design. Res. J. Agr. Biol. Sci. 5(5), 754-761.
Ozdemir, M., B.F. Ozen, L.L. Dock, and J.D. Floros. 2008. Optimization of osmotic dehydration of diced green peppers by response surface methodology. LWT-Food Sci. Technol. 41(10), 2044-2050.
Park, K.J., A. Bin, F.P.R Brod, and T.H.K.B. Park. 2002. Osmotic dehydration kinetics of pear D'anjou (Pyrus communis L.). J. Food Eng. 52(3), 293-298. Doi: 10.1016/S0260-8774(01)00118-2.
Peiró, R., M.M. Camacho, and N. Martínez. 2007. Compositional and physicochemical changes associated to successive osmode-hydration cycles of pineapple (Ananas comosus). J. Food Eng. 79(3), 842-849. Doi: 10.1016/j.jfoodeng.2006.03.004.
Peleg, M. 1988. An empirical model for the description of moisture sorption curves. J. Food Sci. 53(4), 1216-1219. Doi: 10.1111/ j.1365-2621.1988.tb13565.x.
Phisut, N. 2012. Factors affecting mass transfer during osmotic dehydration of fruits. Int. Food Res. J. 19(1), 7-18.
Rastogi, N.K. and K.S.M.S. Raghavarao. 2004. Mass transfer during osmotic dehydration of pineapple: considering Fickian diffusion in cubical configuration. LWT-Food Sci. Technol. 37(1), 43-47. Doi: 10.1016/S0023-6438(03)00131-2.
Restrepo, A.M., M. Cortés, and C.J. Márquez. 2009. Cape gooseberry (Physalis peruviana L.) minimally processed fortified with vitamin E. Vitae 16(1), 19-30.
Reyes, G., O. Corzo, N. Bracho, and Y. Rodríguez. 2008. Optimización de la deshidratación osmótica con pulso de vacío de láminas de sardinas. Rev. Cient. 18(3), 320-328.
Ryan, E.A., M.E. Pick, and C. Marceau. 2001. Use of alternative medicines in diabetes mellitus. Diabetic Med. 18(3), 242-245. Doi: 10.1046/j.1464-5491.2001.00450.x.
Saxena, S., B.B Mishra, R. Chander, and A. Sharma. 2009. Shelf stable intermediate moisture pineapple (Ananas comosus) slices using hurdle technology, LWT-Food Sci. Technol. 42(10), 1681-1687. Doi: 10.1016/j.lwt.2009.05.009.
Sharma, R.R., D. Singh, and R. Singh. 2009. Biological control of postharvest diseases of fruits and vegetables by microbial antagonists: A review. Biol. Contr. 50(3), 205-221. Doi: 10.1016/j. biocontrol.2009.05.001.
Stangeland, T., S.F. Remberg, and K.A. Lye. 2009. Total antioxidant activity in 35 Ugandan fruits and vegetables. Food Chem. 113(1), 85-91. Doi: 10.1016/j.foodchem.2008.07.026.
Tiganitas, A., N. Zeaki, A.S. Gounadaki, E.H. Drosinos, and P.N. Skandamis. 2009. Study of the effect oflethal and sublethal pH and aw stresses on the inactivation or growth of Listeria monocytogenes and Salmonella typhimurium. Int. J. Food Microbiol. 134(1-2), 104-112. Doi: 10.1016/j.ijfoodmicro.2009.02.016.
Tortoe, C. 2010. A review of osmodehydration for food industry. Afr. J. Food Sci. 4(6), 303-324.
Valdez, A., S.I. Martínez, F. Salais, J. Welti, and H. Mújica. 2007. Vacuum pulse-assisted pickling whole jalapeño pepper optimization. J. Food Eng. 79(4), 1261-1268. Doi: 10.1016/j.jfoodeng.2006.04.041.
Wu, S.J., L.T Ng, C.H. Chen, D.L. Lin, S.S. Wang, and C.C. Lin. 2004a. Antihepatoma activity of Physalis angulata and P. peruviana extracts and their effects on apoptosis in human Hep G2 cells. Life Sci. 74(16), 2061-2073. Doi: 10.1016/j.lfs.2003.09.058.
Wu, S.J., L.T Ng, D.L. Lin, S.N. Huang, S.S. Wang, and C.C. Lin. 2004b. Physalis peruviana extract induces apoptosis in human Hep G2 cells through CD95/CD95L system and the mitochondrial signaling transduction pathway. Cancer Lett. 215(2), 199-208. Doi: 10.1016/j.canlet.2004.05.001.
Wu, S.J., L.T Ng, Y.M. Huand, D.L. Lin, S.S. Wang, S.N. Huang, and C.C. Lin. 2005 Antioxidant activities of Physalis peruviana. Biol. Pharm. Bull. 28(6), 963-966. Doi: 10.1248/bpb.28.963.
Wu, S.J., J.Y. Tsai, S.P. Chang, D.L. Lin, S.S. Wang, S.N. Huang, and L.T. Ng. 2006. Supercritical carbon dioxide extract exhibits enhanced antioxidant and anti-inflammatory activities of Physalis peruviana. J. Ethnopharm. 108(3), 407-413. Doi: 10.1016/j.jep.2006.05.027.
Zapata, J.E., J.M. Arias, and G.L. Ciro. 2011. Optimization of osmotic dehydration ofpineapple (Ananas comosus L.) using the response surface methodology. Agron. Colomb. 29(2), 249-256.
Zapata, J.E., L.M. Carvajal, and N. Ospina. 2004. Aplicación de métodos combinados para la conservación de papaya hawaiana (Carica papaya) cortada en láminas. Aliment. Equipos Tecnol. 23(190), 113-120.
Zapata, J.E. and A. Montoya. 2012. Deshidratación osmótica de láminas de mango cv. Tommy Atkins aplicando metodología de superficies de respuesta. Rev. Fac. Nal. Agron. 65(1), 6507-6518.
Zapata, J.E., O.A. Quintero, and L.D. Porras. 2014. Sorption isotherms for oat flakes (Avena sativa L.). Agron. Colomb. 32(1), 52-58. Doi: 10.15446/agron.colomb.v32n1.40652.
Zhu, S.J. 2006. Non-chemical approaches to decay control in post-harvest fruit. pp. 297-313. In: Noureddine, B. and S. Norio. (eds.). Advances in postharvest technologies for horticultural crops. Research Signpost, Trivandrum, India.
References
Akbarian, M., N. Ghasemkhani, and F. Moayed. 2014. Osmotic dehydration of fruits in food industrial: A review. Int. J. Biosci. 4(1), 42-57. Doi: 10.12692/ijb/4.1.42-57.
Alakali, J.S., C.C. Ariahu, and N.N. Nkpa. 2006. Kinetics of osmotic dehydration of mango. J. Food Process. Preserv. 30(5), 597-607. Doi: 10.1111/j.1745-4549.2006.00080.x.
Allali, H., L. Marchal, and E. Vorobiev. 2010. Effects of vacuum impregnation and ohmic heating with citric acid on the behaviour of osmotic dehydration and structural changes of apple fruit. Biosyst. Eng. 106(1), 6-13. Doi: 10.1016/j. biosystemseng.2009.08.005.
AOAC. 1995. Official methods of analysis of AOAC international. 16th ed. Gaithersburg, MD.
Assis F, R. Morais, and A. Morais. 2016. Mass transfer in osmotic dehydration of food products: comparison between mathematical models. Food Eng. Rev. 8(2), 116-133. Doi: 10.1007/ s12393-015-9123-1.
Arreola, S.I. and M.E. Rosas. 2007. Aplicación de vacío en la deshidratación osmótica de higos (Ficus carica). J. Inf. Technol. 18(2), 43-38. Doi: 10.4067/S0718-07642007000200006.
Arun, M. and V.V. Asha. 2007. Preliminary studies on antihepatotoxic effect of Physalis peruviana Linn. (Solanaceae) against carbon tetracloride induced acute liver injury in rats. J. Ethnopharmacol. 111(1), 110-114. Doi: 10.1016/j.jep.2006.10.038.
Azuara, E., C.I. Beristain, and H.S. Garcia. 1992. Development of a mathematical model to predict kinetics of osmotic dehydration. J. Food Sci. Technol. 29(4), 239-242.
Bekele, Y. and H.S Ramaswamy. 2010. Going beyond conventional osmotic dehydration for quality advantage and energy savings. Ethiop. J. Appl. Sci. Technol. 1(1), 1-15.
Castro, A.M., L. Rodríguez, and E.M Vargas. 2008. Secado de Uchuva (Physalisperuviana L.) por aire caliente con pretratamiento de osmodeshidratación. Vitae 15(2), 226-231.
Chauhan, O.P., A. Shah, A. Singh, P.S Raju, and A.S Bawa. 2009. Modeling of pre-treatment protocols for frozen pineapple slices, LWT-Food Sci. Technol. 42(7), 1283-1288. Doi: 10.1016/j.lwt.2009.02.019.
Chavan, U.D. and R. Amarowicz. 2012. Osmotic dehydration process for preservation of fruits and vegetables. J. Food Res. 1(2), 202-209. Doi: 10.5539/jfr.v1n2p202.
Corrêa, J.L.G., L.M. Pereira, G.S. Vieira, and M.D. Hubinger. 2010. Mass transfer kinetics of pulsed vacuum osmotic dehydration of guavas. J. Food Eng. 96(4), 498-504. Doi: 10.1016/j. jfoodeng.2009.08.032.
Crank, J. 1975. The mathematics of diffusion. 2nd ed. Oxford University Press, London.
Fermin, W.J. and O. Corzo. 2005. Optimization of vacuum osmotic dehydration of cantaloupe using response surface methodology. J. Food Process. Preserv. 29(1), 20-32. Doi: 10.1111/j.1745-4549.2005.00010.x.
Ferrari, C.C. and M.D. Hubinger. 2008. Evaluation of the mechanical properties and diffusion coefficients of osmodehydrated melon cubes. Int. J. Food Sci. Technol. 43 (11), 2065-2074. Doi:10.1111/j.1745-4549.2005.00010.x.
Fischer, G., P.J. Almanza-Merchán, and D. Miranda. 2014. Importancia y cultivo de la uchuva (Physalisperuviana L.). Rev. Bras. Frutic. 36(1), 1-15. Doi: 10.1590/0100-2945-441/13.
Giraldo, D.P., L.M Arango, and C.J Márquez. 2005. Osmodehydration of Blackberry (Rubus glaucus Benth) with three sweetening agents. Rev. Fac. Nal. Agron. 57(1), 2257-2274.
Giraldo, G., P. Talens, P. Fito, and A. Chiralt. 2003. Influence of sucrose solution concentration on kinetics and yield during osmotic dehydration of mango. J. Food Eng. 58(1), 33-43. Doi: 10.1016/S0260-8774(02)00331-X.
Huayamave, E.C. and F. Cornejo. 2005. Influencia de presiones de vacío en la transferencia de masa durante la deshidratación osmótica del mango. Rev. Tecnol. ESPOL 18(1), 141-145.
Jalaee, F., A. Fazeli, H. Fatemian, and H. Tavakolipour. 2011. Mass transfer coefficient and the characteristics of coated apples in osmotic dehydrating. Food Bioprod. Process. 89(4), 367-364. Doi: 10.1016/j.fbp.2010.09.012.
Khan, M.R. 2012. Osmotic dehydration technique for fruits preservation - A review. J. Food Sci. 22(2), 71-85.
Lombard, G.E., J.C. Oliveira, P. Fito, and A. Andrés. 2008. Osmotic dehydration of pineapple as a pre-treatment for further drying. J. Food Eng. 85(2), 277-284. Doi: 10.1016/j.jfoodeng.2007.07.009.
Maldonado, S., J.E Santapaola, J. Singh, M. Torrez, and A. Garay. 2008. Cinética de la transferencia de masa durante la deshidratación osmótica de yacón (Smallanthus sonchifolius). Food Sci. Technol. 28(1), 251-256. Doi: 10.1590/ S0101-20612008000100036.
Marín, Z., M. Cortés, and O. Montoya. 2010. Evaluación sensorial de uchuva (Physalisperuviana L.) ecotipo Colombia impregnada con la cepa nativa Lactobacillus plantarum lpbm10 y la cepa comercial Lactobacillus casei ATCC 393. Vitae 17(1), 21-28.
Marquez, C.J., O. Trillos, J.R Cartagena, and J.M Cotes. 2009. Evaluación físico-química y sensorial de frutos de Uchuva (Physalis peruviana L.). Vitae 16(1), 42-48.
Melquíades, Y.I, C. López, and M.E. Rosas. 2009. Estudio de la cinética de rehidratación de zanahoria (Daucus carota) deshidratadas. Inf. Tecnol. 20(3), 65-72. Doi: 10.1612/inf.tecnol.4037it.08.
Mújica, H., A. Valdez, A. López, E. Palou, and J. Welti. 2003a. Impregnation and osmotic dehydration of some fruits: effect of the vacuum pressure and syrup concentration. J. Food Eng. 57(4), 305-304. Doi: 10.1016/S0260-8774(02)00344-8.
Mújica-Paz, H., A. Valdez-Fragoso, A. LópezMalo, E. Palou, and J. Welti-Chanes. 2003b. Impregnation and osmotic dehydration of some fruits: effect of thevacuum pressure and syrup concentration. J. Food Eng. 57, 305-314. Doi: 10.1016/S0260-8774(02)00344-8.
Ngoran, B.Z., E. Assidjo, P. Kouamé, I. Dembele, and B. Yao. 2009. Modelling of osmotic dehydration ofmango (Mangifera indica) by recurrent artificial neural network and experimental design. Res. J. Agr. Biol. Sci. 5(5), 754-761.
Ozdemir, M., B.F. Ozen, L.L. Dock, and J.D. Floros. 2008. Optimization of osmotic dehydration of diced green peppers by response surface methodology. LWT-Food Sci. Technol. 41(10), 2044-2050.
Park, K.J., A. Bin, F.P.R Brod, and T.H.K.B. Park. 2002. Osmotic dehydration kinetics of pear D'anjou (Pyrus communis L.). J. Food Eng. 52(3), 293-298. Doi: 10.1016/S0260-8774(01)00118-2.
Peiró, R., M.M. Camacho, and N. Martínez. 2007. Compositional and physicochemical changes associated to successive osmode-hydration cycles of pineapple (Ananas comosus). J. Food Eng. 79(3), 842-849. Doi: 10.1016/j.jfoodeng.2006.03.004.
Peleg, M. 1988. An empirical model for the description of moisture sorption curves. J. Food Sci. 53(4), 1216-1219. Doi: 10.1111/ j.1365-2621.1988.tb13565.x.
Phisut, N. 2012. Factors affecting mass transfer during osmotic dehydration of fruits. Int. Food Res. J. 19(1), 7-18.
Rastogi, N.K. and K.S.M.S. Raghavarao. 2004. Mass transfer during osmotic dehydration of pineapple: considering Fickian diffusion in cubical configuration. LWT-Food Sci. Technol. 37(1), 43-47. Doi: 10.1016/S0023-6438(03)00131-2.
Restrepo, A.M., M. Cortés, and C.J. Márquez. 2009. Cape gooseberry (Physalis peruviana L.) minimally processed fortified with vitamin E. Vitae 16(1), 19-30.
Reyes, G., O. Corzo, N. Bracho, and Y. Rodríguez. 2008. Optimización de la deshidratación osmótica con pulso de vacío de láminas de sardinas. Rev. Cient. 18(3), 320-328.
Ryan, E.A., M.E. Pick, and C. Marceau. 2001. Use of alternative medicines in diabetes mellitus. Diabetic Med. 18(3), 242-245. Doi: 10.1046/j.1464-5491.2001.00450.x.
Saxena, S., B.B Mishra, R. Chander, and A. Sharma. 2009. Shelf stable intermediate moisture pineapple (Ananas comosus) slices using hurdle technology, LWT-Food Sci. Technol. 42(10), 1681-1687. Doi: 10.1016/j.lwt.2009.05.009.
Sharma, R.R., D. Singh, and R. Singh. 2009. Biological control of postharvest diseases of fruits and vegetables by microbial antagonists: A review. Biol. Contr. 50(3), 205-221. Doi: 10.1016/j. biocontrol.2009.05.001.
Stangeland, T., S.F. Remberg, and K.A. Lye. 2009. Total antioxidant activity in 35 Ugandan fruits and vegetables. Food Chem. 113(1), 85-91. Doi: 10.1016/j.foodchem.2008.07.026.
Tiganitas, A., N. Zeaki, A.S. Gounadaki, E.H. Drosinos, and P.N. Skandamis. 2009. Study of the effect oflethal and sublethal pH and aw stresses on the inactivation or growth of Listeria monocytogenes and Salmonella typhimurium. Int. J. Food Microbiol. 134(1-2), 104-112. Doi: 10.1016/j.ijfoodmicro.2009.02.016.
Tortoe, C. 2010. A review of osmodehydration for food industry. Afr. J. Food Sci. 4(6), 303-324.
Valdez, A., S.I. Martínez, F. Salais, J. Welti, and H. Mújica. 2007. Vacuum pulse-assisted pickling whole jalapeño pepper optimization. J. Food Eng. 79(4), 1261-1268. Doi: 10.1016/j.jfoodeng.2006.04.041.
Wu, S.J., L.T Ng, C.H. Chen, D.L. Lin, S.S. Wang, and C.C. Lin. 2004a. Antihepatoma activity of Physalis angulata and P. peruviana extracts and their effects on apoptosis in human Hep G2 cells. Life Sci. 74(16), 2061-2073. Doi: 10.1016/j.lfs.2003.09.058.
Wu, S.J., L.T Ng, D.L. Lin, S.N. Huang, S.S. Wang, and C.C. Lin. 2004b. Physalis peruviana extract induces apoptosis in human Hep G2 cells through CD95/CD95L system and the mitochondrial signaling transduction pathway. Cancer Lett. 215(2), 199-208. Doi: 10.1016/j.canlet.2004.05.001.
Wu, S.J., L.T Ng, Y.M. Huand, D.L. Lin, S.S. Wang, S.N. Huang, and C.C. Lin. 2005 Antioxidant activities of Physalis peruviana. Biol. Pharm. Bull. 28(6), 963-966. Doi: 10.1248/bpb.28.963.
Wu, S.J., J.Y. Tsai, S.P. Chang, D.L. Lin, S.S. Wang, S.N. Huang, and L.T. Ng. 2006. Supercritical carbon dioxide extract exhibits enhanced antioxidant and anti-inflammatory activities of Physalis peruviana. J. Ethnopharm. 108(3), 407-413. Doi: 10.1016/j.jep.2006.05.027.
Zapata, J.E., J.M. Arias, and G.L. Ciro. 2011. Optimization of osmotic dehydration ofpineapple (Ananas comosus L.) using the response surface methodology. Agron. Colomb. 29(2), 249-256.
Zapata, J.E., L.M. Carvajal, and N. Ospina. 2004. Aplicación de métodos combinados para la conservación de papaya hawaiana (Carica papaya) cortada en láminas. Aliment. Equipos Tecnol. 23(190), 113-120.
Zapata, J.E. and A. Montoya. 2012. Deshidratación osmótica de láminas de mango cv. Tommy Atkins aplicando metodología de superficies de respuesta. Rev. Fac. Nal. Agron. 65(1), 6507-6518.
Zapata, J.E., O.A. Quintero, and L.D. Porras. 2014. Sorption isotherms for oat flakes (Avena sativa L.). Agron. Colomb. 32(1), 52-58. Doi: 10.15446/agron.colomb.v32n1.40652.
Zhu, S.J. 2006. Non-chemical approaches to decay control in post-harvest fruit. pp. 297-313. In: Noureddine, B. and S. Norio. (eds.). Advances in postharvest technologies for horticultural crops. Research Signpost, Trivandrum, India.
How to Cite
APA
ACM
ACS
ABNT
Chicago
Harvard
IEEE
MLA
Turabian
Vancouver
Download Citation
CrossRef Cited-by
1. Ali Asghari, P. Assana Zongo, Emmanuel Freddy Osse, Sara Aghajanzadeh, Vijaya Raghavan, Seddik Khalloufi. (2024). Review of osmotic dehydration: Promising technologies for enhancing products’ attributes, opportunities, and challenges for the food industries. Comprehensive Reviews in Food Science and Food Safety, 23(3) https://doi.org/10.1111/1541-4337.13346.
2. Adriano Lucena de ARAÚJO, Rosinelson da Silva PENA. (2022). Influence of process conditions on the mass transfer of osmotically dehydrated jambolan fruits. Food Science and Technology, 42 https://doi.org/10.1590/fst.37520.
3. Lilian Carcamo-Medina, Mildred Eleazar-Turcios, Luis Eduardo Ordoñez-Santos. (2019). Cambios en los compuestos bioactivos del jugo de uchuva (Physalis peruviana L.) pasteurizado. TecnoLógicas, 22(45), p.145. https://doi.org/10.22430/22565337.1279.
4. Manuela Gallón Bedoya, Soany Karola Eraso Grisales, Misael Cortés Rodríguez. (2021). Avances tecnológicos en el proceso de transformación de la uchuva: una revisión. Revista Facultad de Ciencias Básicas, 16(1), p.7. https://doi.org/10.18359/rfcb.5019.
5. Alicia GRAJALES-LAGUNES, Luis CABRERA-RUIZ, Federico GUTIÉRREZ-MICELI, Miguel Angel RUIZ-CABRERA, Luc DENDOOVEN, Miguel ABUD-ARCHILA. (2019). Anthocyanins from blackberry (Rubus fructicosus L.) impregnated in yam bean (Pachyrhizus erosus (L.) Urb.) by osmotic dehydration. Food Science and Technology, 39(4), p.922. https://doi.org/10.1590/fst.15618.
6. Luis Eduardo Ordóñez-Santos, Jader Martínez-Girón, Maria Enith Arias-Jaramillo. (2017). Effect of ultrasound treatment on visual color, vitamin C, total phenols, and carotenoids content in Cape gooseberry juice. Food Chemistry, 233, p.96. https://doi.org/10.1016/j.foodchem.2017.04.114.
Dimensions
PlumX
Article abstract page views
Downloads
License
Copyright (c) 2016 Agronomía Colombiana

This work is licensed under a Creative Commons Attribution-NonCommercial-ShareAlike 4.0 International License.
© Centro Editorial de la Facultad de Ciencias Agrarias, Universidad Nacional de Colombia
Reproduction and quotation of material appearing in the journal is authorized provided the following are explicitly indicated: journal name, author(s) name, year, volume, issue and pages of the source. The ideas and observations recorded by the authors are their own and do not necessarily represent the views and policies of the Universidad Nacional de Colombia. Mention of products or commercial firms in the journal does not constitute a recommendation or endorsement on the part of the Universidad Nacional de Colombia; furthermore, the use of such products should comply with the product label recommendations.
The Creative Commons license used by Agronomia Colombiana journal is: Attribution - NonCommercial - ShareAlike (by-nc-sa)

Agronomia Colombiana by Centro Editorial of Facultad de Ciencias Agrarias, Universidad Nacional de Colombia is licensed under a Creative Commons Reconocimiento-NoComercial-CompartirIgual 4.0 Internacional License.
Creado a partir de la obra en http://revistas.unal.edu.co/index.php/agrocol/.


